You are viewing 1 of your 1 free articles
 Jules Birch
The state of private renting
In the second in a series of pieces examining findings from the English Housing Survey, Jules Birch looks at the private rented sector
Jules BirchAs homeownership and social renting continue to decline, the astonishing rise and rise of the private rented sector continues.
But who is the sector housing and what are the consequences for tenants?
Here are a dozen key points that I picked out from the English Housing Survey for 2015/16.


1 Overall growth
One in five of us – 4.5 million households – now rent from a private landlord. That is 2.5 million more than in 2000.
2 Age
Growth continues to be fastest among young people as high house prices stop them buying and social housing is in short supply.
The proportion of 25 to 34-year-olds renting from a private landlord has increased from 24% to 46% in the past 10 years. As recently as 1991, just 12.9% of 25 to 34-year-olds were private tenants.
That figure is for households, so it could well mask an even stronger growth in the number of individual young people renting as more of them share.
The average private renter household reference person (HRP) – the oldest or highest-earning person in the household – is 40, making them much younger than social renter HRPs (52) and owner-occupier HRPs (57).
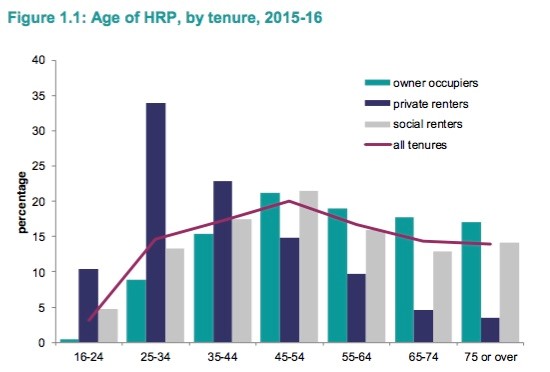
However, since the financial crisis, private renting has grown among all age groups, with sharp increases also seen among the 35-44s, 45-54s and 55-64s.
3 Children
Following on from that point about age, the proportion of families with dependent children renting privately has risen from 30% to 36% over the past 10 years.
Given the overall growth in the sector, that is getting on for an extra million more families with children.

The proportion of lone parents with dependent children rose from 9% to 11% and there are now 519,000 of these households, compared with 229,000 10 years ago.
That was matched by a fall in the number of lone parents with children in social renting from 686,000 to 564,000 in the past 10 years.
4 Ethnicity and nationality
A quarter of private renters had a non-UK or Irish HRP, making the sector much more diverse than social renting (8%) and owner-occupation (3%).
5 Affordability
Taking into account the incomes of everyone in the household, the mean of £673 a week for private renters puts them midway between social renters (£394) and people buying with a mortgage (£1,071).
However, average weekly private rents (£184) were not just higher than social rents but also average mortgage costs (£159).

Put those factors together and private renters spend the highest proportion of their incomes (35%) on rent.
Unsurprisingly, affordability is worst for private renters in London, where average rents take up 45% of incomes.

6 Housing benefit
Some 24% of private renters received housing benefit in 2015/16, the equivalent of 1.1 million households. However, less than a quarter of those had their full rent covered.
That is a graphic illustration of the way the Local Housing Allowance (LHA) has increasingly left private renters with shortfalls against their rent. The freeze in LHA rates and shared accommodation rate for the under-35s mean the gap is rising year-on-year.
Landlords are increasingly reacting by refusing to rent to the under-35s, according to research for the Residential Landlords Association this week.
Given that the under-35s are the fastest-growing private renter demographic, that can only spell trouble ahead.
7 Length of tenancy
Private renters had lived in their accommodation for an average of 4.3 years, compared with 11.6 years for social renters and 17.8 for owner-occupiers.
However, this average may overstate stability for most renters. Just over a quarter of them had lived in their current accommodation for less than a year, while one in 10 had lived in their current home for 10 years or more.
This may reflect a diminishing number of older tenants who have been in their homes for years on pre-1988 regulated tenancies.
This graph shows the length of time lived in the home by age group:

8 Moves
It unsurprisingly follows that private renters move much more frequently than people in other tenures.
But the insecurity of shorthold tenancies plus the rising number of school-age children is a worrying combination.
Of 2.1 million total house moves in England in 2015/16, 787,000 were by households moving within the private rented sector while 196,000 new private renter households were created.
However, the 256,000 moves out of private renting (172,000 into owner-occupation and 84,000 into social renting) in 2015/16 outnumbered the 187,000 moves in (135,000 from owner-occupation and 52,000 from social renting).
9 Forced moves
Most private renters (73%) said their tenancy ended because they wanted it to.
However, 11% said their landlord or letting agent ended their tenancy and another 10% cited the end of a fixed-term tenancy, a poor relationship with their landlord or a rent increase.

Among those who had moved in the past three years because their landlord asked them to, almost two-thirds (63%) said this was because the landlord wanted to use or sell the property.
These are two of the exceptions in legislation in Scotland ending no-fault evictions and it suggests there would be limits on the impact of similar reforms in England.
10 Conditions and safety
Some 28% of private rented homes failed to meet the Decent Homes Standard. That is double the proportion in social housing (13%) but it has improved markedly over the past 10 years.
However, 17% of private rented homes have at least one Category 1 safety hazard, compared to 13% of owner-occupied and 6% of social rented homes. The main risks were excess cold and falls.

11 Satisfaction
Are private renters satisfied? It depends on how you ask the question.
Ask about their current accommodation, and dissatisfaction among private renters is lower (10%) than among social renters (13%).
Ask about their tenure status, though, and private renters are the least satisfied. Some 21% were dissatisfied with their status as private tenants, including 9% who were very dissatisfied.
That compares to 10% of social renters and less than 1% of owner-occupiers.
12 Aspirations
Some 59% of private renters (2.6 million households) expected to buy at some point. Of those who didn’t expect to buy, 69% said this was because they did not expect to afford it.
Some 7% of private renter households (315,000) included at least one person on a social housing waiting list, with that proportion rising to 12% among households with a dependent child.

 Bill: where are we up to?")


