You are viewing 1 of your 1 free articles
 Jules Birch
The state of owner-occupation
Jules Birch completes his series of articles on the English Housing Survey with a look at homeownership

The decline of owner-occupation in England resumed in 2015/16 after a brief uptick in the previous year.
Owner-occupation as a whole fell below 63% to return it to levels last seen in 1985, when the Right to Buy and Margaret Thatcher’s drive for a property-owning democracy were in full flow.
READ MORE


The ownership rate is now down eight percentage points on its peak in 2003.
However, even that conceals the full scale of the decline. Owner-occupation is made up of two very different groups – people who own their home outright and those who are buying with a mortgage – and the split between them has changed radically over time.
Here are some key points that I picked out from the English Housing Survey for 2015/16:
1) Owning’s rise…
Outright ownership is still rising as people who first took out a mortgage 25 years or more ago pay it off.
From 25% of households (4.5 million) in Ms Thatcher’s heyday, it has grown to overtake mortgaged ownership two years ago and reach 34% (7.7 million) in 2015/16.
2) …and fall
By contrast, mortgaged ownership peaked at 43% (8.5 million) in 1994 and then went into a long decline as the number of first-time buyers fell. The decline accelerated after the financial crisis.
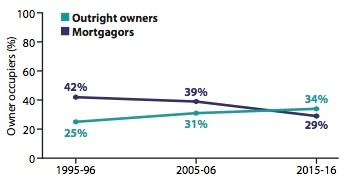
Despite all the rhetoric about aspiration and the billions poured into Help to Buy, mortgaged ownership stood at just 29% (6.6 million) in 2015/16.
That is lower than when the Right to Buy was first introduced and the decline has been happening for more than 20 years.
There were 654,000 first-time buyers in 2015/16, compared to 675,000 in 2005/06 and 922,000 in 1995/96.
3) Ownership by age…
These trends are set to continue because of factors already hard-wired into the housing system.
Worryingly for the future, almost half of mortgagors were aged between 45 and 64 and just 18% were aged 16-34 (down from 29% in 1995/96).
This graph shows what’s happened over the past 20 years:

4) …and by income
Getting on the housing ladder has always depended on income to a large extent but mortgaged ownership has become even more concentrated at the higher end of the income scale in the past 10 years.
Some 39% of mortgagors were in the highest income quintile (the top 20% of earners) in 2015/16 and 68% were in the top two quintiles.
And it’s not just about income: friends and family now help 29% of first-time buyers with their deposit and access to the housing market is becoming increasingly dependent on family wealth and inheritance.
5) The borrowers
As house prices rise, so mortgages have got larger. The average mortgage taken out in 2015/16 was £158,000. That compares with £110,000 for people taking a mortgage out 11-15 years ago and just £59,000 for 21-25 years ago.
However, even that has not been enough to keep up with house prices, leaving rising numbers of would-be first-time buyers unable to raise big enough loans to be able to buy:

6) Affordability
Mortgages may be getting bigger, but thanks to record low interest rates they are still relatively affordable for most people.
Two out of three mortgagors spent less than 20% of their household income on repaying their loan in 2015/16:

The affordability squeeze was heavily concentrated at the lower end of the income scale. More than half of mortgagors in the lowest income quintile were spending more than 30% of their income on their mortgage.
7) Longer loans
In another sign of affordability pressures, a quarter of mortgages taken out in the past two years were for terms longer than the traditional 25 years. That compares with just 3% of mortgages taken out 11-15 years ago.
Among people aged 16-34 who had managed to get on the housing ladder, 24% had a loan term of 26-30 years and 23% had one for 31 years or more.
In total, some 40% of all first-time buyers had a loan term of more than 30 years. That may mean lower monthly payments but it also means they will pay more over the longer term.
8) Low arrears
As the financial crisis hit 10 years ago, policymakers feared a repeat of the surge in arrears and repossessions seen in the housing market crash of the early 1990s.
Thanks to low interest rates and other factors identified above, that did not happen. Only 51,000 mortgagors (1%) were behind with their payments in 2015/16.
However, that could change quickly when (and if) interest rates rise again.
9) Interest-only
How many owners are not really owners? Despite a clampdown on interest-only mortgages after the financial crisis, some 7% of borrowers still had this sort of loan in 2015/16.
Of those, more than a third (35%) planned to pay off their mortgage from the sale of their home. Effectively they are long-term renters.
10) Future homeowners
The 2015/16 survey found that 59% of private renters (2.6 million households) expected to buy at some point in the future, unchanged from 2014/15.
The proportion of social renters expecting to buy rose from 24% to 27% (one million), perhaps reflecting the Right to Buy hopes of housing association tenants.
However, just 25% of private renters and 18% of social renters expected to buy within the past two years.
Among those not expecting to buy, affordability was seen as the main barrier to homeownership but some said they liked it where they were (10%) or preferred the flexibility of renting (3%).
That almost completes my three-part look at highlights from the English Housing Survey but there is one final important point to note about a significant group of people who do not fit into any of the tenure categories.
Some 7% of all households (1.5 million) contained at least one adult who would like to buy or rent their own accommodation but could not afford it.
In total, there were 1.9 million of these ‘additional adults’ living as part of other households. Most were working (80%) and the vast majority were aged under 35 (89%).
Jules Birch, award-winning blogger
 Bill: where are we up to?")


