You are viewing 1 of your 1 free articles
A closer look at the NAO report on housing
A new overview of housing in England from the National Audit Office (NAO) provides some revealing insights on the state of the nation ahead of the Housing White Paper. Here are some highlights.
The NAO estimates that 174,000 net additional homes a year are needed to meet the government’s target of a million new homes by 2020.
That’s fewer than the 190,000 delivered in 2015/16, the first of the five years covered by the target.
Confused? How on earth can the government meet such an ambitious target by building fewer homes? The answer is that it has moved the goalposts twice.
The first is one I’ve blogged about several times before. Using the higher net additions figure as a benchmark, rather than the completions in the housebuilding statistics, is reasonable in my view since the latter undercounts housebuilding and does not include conversions and change of use.
However, it also means that the million homes target was not very ambitious in the first place.
The second is revealed in the NAO report: the Department for Communities and Local Government (DCLG) has quietly moved the end date for the target from the end of the parliament (May 2020) to the end of the year (December 2020).
The report criticises the DCLG for not previously setting out that its five-year target actually covers five years and nine months.
Hey presto, the target for more new homes can be met by building fewer of them:
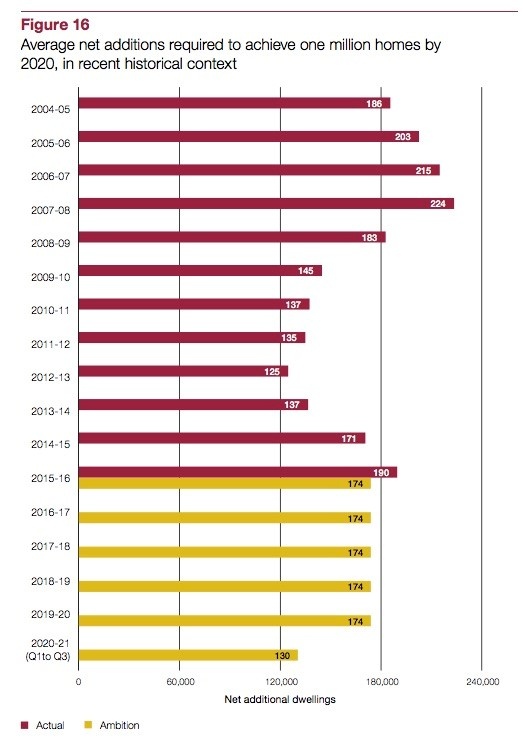
It all suddenly looks like a very unambitious ambition.
As the NAO sums things up:
“At the centre of the government’s plans is its ambition of adding one million new homes by 2020, achievement of which does not require there to be a substantial increase in current levels of housebuilding.”
Where does the money go? (1)
Total government spending on housing in England was £28bn in 2015/16.
Three-quarters of it (£20.9bn) went on housing benefit and less than a tenth (£2.4bn) to the Homes and Communities Agency for new homes.
This does not include off-balance-sheet loans and guarantees such as Help to Buy.
Where did the money go? (2)
Those are big numbers but they are dwarfed by the total value of the housing stock in England. Using research from Savills, the NAO estimates this at £5.6tn in 2015.
That’s £5,600,000,000,000 or 200 times the annual housing budget. Between 2010 and 2015 – the years of austerity – the total value increased by £1tn. Yet, as the NAO also highlights, most of this goes untaxed.
Stamp duty may raise £11bn a year (and has just been increased for additional homes) but that is only paid if you buy a home or move.
The NAO estimates that principal private residence relief from capital gains tax on the profits when you sell a home was worth £16bn in 2015/16. Given the number of zeros quoted above, is that an underestimate?
The NAO also highlights its previous warnings that HMRC has “weak oversight” of the relief and that “widespread misuse” may be going undetected.
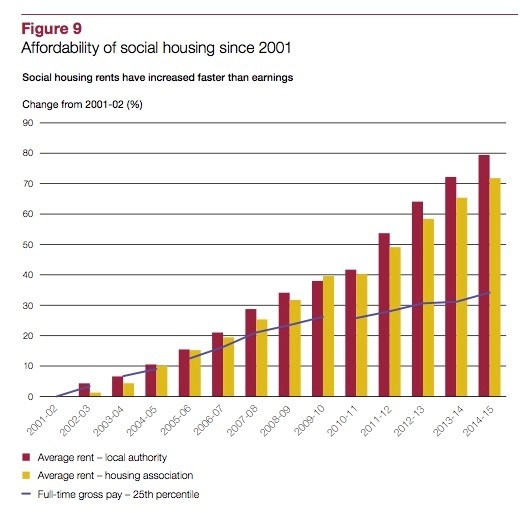
Affordable for who?
Low interest rates have made housing much more affordable for homeowners, provided they can get a mortgage. The proportion of owner-occupiers spending at least 25% of their income on housing has fallen from 40% to 19% since 2008.
The squeeze has come on first-time buyers who need to borrow more with a bigger deposit, on private renters in London and on social renters everywhere. Average full-time gross pay at the 25th percentile rose by 34% between 2001 and 2014/15 but after years of an inflation plus rent formula, housing association rents were up 72% and council rents 79%.
Much of the bill for those higher rents has of course been paid by housing benefit and they were also part of a trade-off that supported the delivery of new homes.
We are now into a new era of rent cuts but the NAO notes the knock-on effect on delivery as one example of the “potental for tension” between the objectives of different government departments.
In particular, it highlights analysis by the Chartered Institute of Public Finance and Accountancy, which I hadn’t seen before, and suggests the rent reduction means that no council will have the cash to build any new homes between 2017/18 and 2028/29.
However, note too that the figures in the graph do not include the switch to affordable rent. The NAO says that new tenants with affordable rents in London in 2014/15 typically paid 60% more than new tenants in London on social rents.
Ownership or bust
Two of the DCLG’s strategic objectives are to drive up housing supply and increase homeownership.
If the first looks less ambitious than it seems, it is still supported by 16 different housing programmes detailed in the report, with some mixed results.

Progress on the second will be revealed in the latest English Housing Survey in a few weeks’ time but it is supported by 11 different programmes and comes with a price attached. The NAO highlights its previous forecast that the rate of replacements for homes sold under the Right to Buy needs to quintuple from current levels to meet the government’s one-for-one promise.
That’s just a flavour of the NAO’s overview of housing in England. Coverage of much more, including housing tenure, housing conditions and homelessness, is available in the full report. Data visualisations at national and local authority levels are available on the NAO website here.