You are viewing 1 of your 1 free articles
Rise in tenancy terminations
As the number of notices seeking possession rises, Carl Brown investigates why landlords are taking a tougher line
‘At the end of the day, are rent arrears always the tenant’s fault?’ asks Michael Gelling, chair of the Tenants’ and Residents’ Organisations of England.
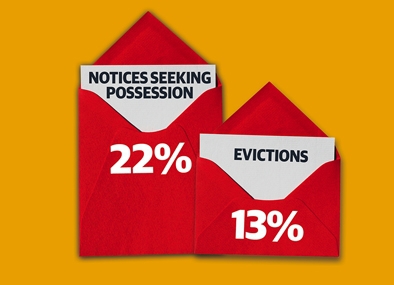
Mr Gelling is reflecting on the results of an exclusive Inside Housing survey that shows councils and housing associations are getting tougher on tenants who don’t pay their rent. A total of 167 social landlords issued 239,381 notices seeking possession - eviction warning notices - for rent arrears in 2013/14. This was a 22 per cent increase on the previous year. More worryingly perhaps, actual evictions for rent arrears also increased by 13 per cent to 7,131.
So what is going on? Why are landlords seemingly acting tougher to terminate tenancies?
The easy temptation is to blame work and pensions secretary Iain Duncan Smith and his raft of welfare reforms, including the bedroom tax, £26,000 annual benefits cap and universal credit.
Certainly a lot of social landlords we surveyed have done just that. A total of 59 landlords suggested welfare reforms have been partly or wholly to blame for increases in NSPs or evictions, although most of these also cite other reasons, such as rising living costs and the economic climate.
Video:
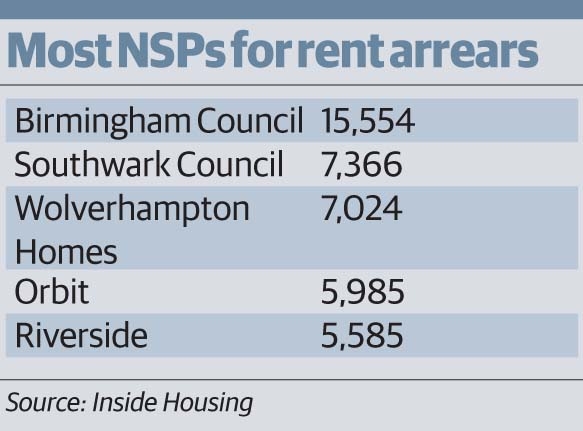
Organisations with the most notices seeking possession orders
Taking the bedroom tax first, a number of landlords have specifically cited this as the reason for an increase in NSPs. Spectrum Housing Group issued 1,108 NSPs for rent arrears in 2013/14, an increase of 94 on the previous year. A spokesperson for the 18,000-home landlord said 45 households have been served an NSP ‘solely as a result’ of the bedroom tax. He said the penalty had also ‘worsened the financial situation’ of a further 40 served a notice. Arm’s-length management organisation Blackpool Coastal says 94 of the extra 96 NSPs it served last year were to tenants affected by the bedroom tax.
Exerting pressure
While NSPs are merely threats of eviction and are often used to exert greater pressure on non-paying tenants, some landlords are also saying the bedroom tax may have played a role in actual evictions. Walsall Housing Group and Link Housing Association both evicted bedroom tax affected tenants last year. In reality, it is difficult in many cases to say the bedroom tax is the sole cause of an eviction, as the policy was only implemented in April 2013. A spokesperson for Welsh landlord RCT Homes says: ‘In many cases, the arrears will have started years before the eviction takes place.’
While a small number of landlords have given these breakdowns of bedroom tax related cases, most cite welfare reform as just one of a number of factors for the increase. Some, including ALMO Ascham Homes and Eastbourne Homes, state emphatically that the bedroom tax is not the reason for an increase in evictions. In terms of the benefit cap, only three landlords - Chesterfield Council, Runnymede Council and Sutton Housing Partnership - mentioned it as a potential reason for increased eviction activity, and as it only affects 40,000 households across Britain, it is difficult to see that as a driver.
The Department for Work and Pensions responded to Inside Housing’s research by suggesting a link between the increased eviction activity and welfare reform is ‘misleading as it is based on speculation’. To some extent this is true, as most of the evidence put forward by landlords is anecdotal. However, there is no doubt among many landlords that welfare reform is playing a role in tenants running up debt.
Aside from welfare reforms that have already come in, social landlords are also preparing for universal credit, under which benefit for housing costs will be paid direct to tenants.
A number of landlords say they have changed their procedures to prevent arrears building up as a result.
Video:
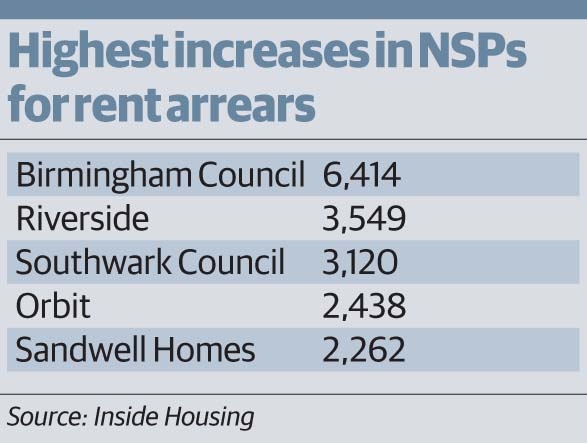
Highest increase of notice seeking possessions
Video:
Landlords with the highest decrease of notice seeking possessions
Orbit issued an extra 2,438 NSPs in 2013/14, taking its annual total to 5,985 - a 68 per cent increase. A spokesperson for the 38,000-home landlord says the increase was ‘due to a change in working practices in preparation for welfare reform’. He says: ‘Earlier and consistent action has resulted in some cases escalating much quicker than they had previously.’
Orbit’s actual evictions fell by a third, suggesting increased use of NSPs can prevent problems building up. Similarly, L&Q issued an extra 1,179 NSPs last year - an increase of 14.7 per cent - but had a 16.4 per cent decrease in evictions. A spokesperson says: ‘This tightening up and focus on arrears prevention meant that our evictions continue on their downward trend.’
Fighting arrears
Tony Stacey, chair of the Placeshapers group of 100 associations, is a fan of this approach of intervening earlier, even if it means more NSPs sent out. He says: ‘The only metric I’m bothered about is the number of evictions. Very often landlords that are issuing NSPs are just taking a defensive position.’ However, Debbie Larner, head of practice at the Chartered Institute of Housing, warns that landlords should look at other ways of communicating with tenants before sending out an NSP. ‘Tenants find it really scary when they get a notice for eviction,’ she says.
A number of councils also report that their rise in NSPs is caused by changing their income collection procedures to tackle arrears earlier. Newham Council, which reported a 13.3 per cent increase in NSPs, suggests that the introduction of self-financing in 2012 placed ‘an additional emphasis… on income generation’.
The NSP increase for the 25 housing associations surveyed was 30.89 per cent, compared to 19 per cent for the 142 councils. This suggests associations may be pursuing arrears more quickly than councils.
Sue Ramsden, policy leader at the National Housing Federation, says ‘like for like’ comparisons are difficult because associations and councils offer different types of tenancies, while Inside Housing’s survey sample for associations is small. However, she says: ‘Evicting residents is the last thing housing associations want to do, but… they simply cannot afford to write off unpaid rent.’
Video:
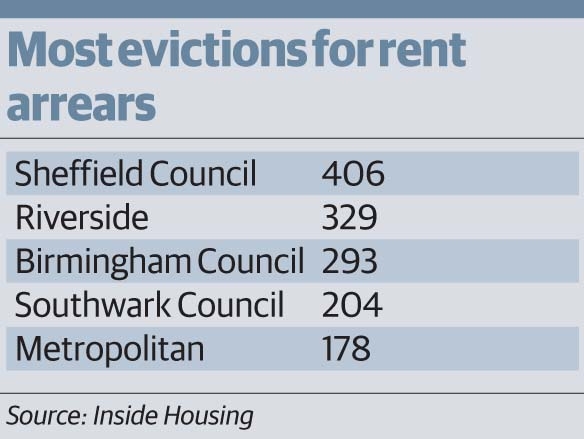
Landlords with most evictions
Video:
Landlords with highest increase of evictions
Mr Stacey believes associations are not being harsher than they have been previously. Instead, he says the increase in NSPs and evictions is purely down to tenants being hit by rising costs. He points to a recent Northern Housing Consortium report, Real life reform - which found the average debt of 100 households surveyed in social housing increased by £52 per week between September 2013 and March 2014. Seven landlords also said harsher benefit sanctions may also have been a factor.
While NSPs are surging across England, a number of Scottish councils have reported falling figures. In fact four of the top five highest decreases in Britain were Scottish authorities. This appears to be due to a combination of some councils adopting ‘no bedroom tax eviction’ policies and a response to pre-action requirements introduced by the Scottish government in August 2012 setting out steps taken before eviction.
Ms Larner says the pre-action protocol in England, which dates from 2006, should also be updated to compel landlords to demonstrate to a court they have offered help with financial inclusion and, in bedroom tax cases, done all they could to help them downsize, before evicting.
Social landlords, faced with funding cuts and a need to raise more private finance, are under great pressure to protect their income streams. But at the same time, their tenants are facing more debt. This is the dilemma that could well lead to more tenancy terminations.
Video:
Local authority full data
Video:
Housing association full data


