You are viewing 1 of your 1 free articles

Meet the Top 50 Biggest Builders
Going up or doing down - how many homes will the UK build? Jess McCabe takes a look into the future with the Top 50 Biggest Builders in the sector
Every year we compile the definitive guide to which housing associations are building the most homes - our league table of the Top 50 Biggest Builders. As well as telling us who is developing, this is a barometer for the sector as a whole.
This year has been a decidedly mixed one for the sector, with completions down substantially on last year, and the sector under-delivering on what it expected. Meanwhile, associations are building more market sale than ever - as the economy plunges into uncharted waters.
The Top 50 completed 31,988 homes in the 2015/16 financial year (see table at bottom) - a 20% drop on the 40,213 managed by last year’s Top 50. We were predicting completions of 34,526 this year, so it is also down 7.4% on expectations. The number of associations building more than 1,000 homes dropped from 13 last year, to only eight this year.
READ MORE


In numbers
31,988
Total number of completions by the Top 50 from 1 April 2015 to 31 March 2016
20%
Drop in completed homes by the Top 50 compared to the previous year
The numbers are not good news for a sector that is under ever-greater pressure to deliver. From government, the message is clear - the housing association movement’s mission is to build.
Paradoxically, though, investment in building those homes has risen - the Top 50 last year invested £4.2bn to build just over 40,000 homes, of which £686m was grant. This year’s Top 50 invested a startling £5.3bn, of which only £490m was grant - a clear indication that housing associations continue to invest in building, as grant falls back.
Making predictions
So when we dig into the numbers, is it a story of under-delivery and missed targets? And what does the future look like?
Partly, 2015/16 was simply a tough year for housing associations. The summer Budget had an unexpected sting in the tail - a 1% rent cut for affordable and social rent for the next four years. Associations build based on grant - but increasingly also by borrowing against their rental income. By tearing up assumptions of future income, the summer Budget forced many associations to pause developments, with an immediate - and potentially long-term - knock-on effect.
However, most of the drop was predictable - remember, we were already expecting completions to fall in 2015/16, albeit not as sharply. That is due to the grant cycle: the 2011/15 Affordable Homes Programme came to a decisive end on 31 March 2015. This inflated last year’s completions.
As Susan Emmett, a director in Savills Residential Research, says: “The ‘drop-dead date’ at the end of the programme would have concentrated housing associations’ efforts to complete homes before the deadline to avoid losing funding. So it’s not surprising to see some fluctuation.”
Top 10 housing associations increasing their stock the most
| Housing association | Number of homes | Percentage increase in stock | From 1 April 2015 to 31 March 2016 how many new homes of any tenure did you complete? |
|---|---|---|---|
| Hightown Housing Association | 5,076 | 7.3% | 369 |
| Saffron | 5,457 | 5.8% | 318 |
| Adactus Housing Group | 13,000 | 4.8% | 625 |
| Orbit Group | 39,127 | 4.5% | 1765 |
| Sentinel | 10,000 | 4.4% | 436 |
| Soha | 6,550 | 4.2% | 274 |
| Wrekin Housing Trust | 13,082 | 3.9% | 512 |
| Paradigm | 14,062 | 3.9% | 542 |
| Swan | 10,963 | 3.8% | 420 |
| Peabody | 28,449 | 3.8% | 1080 |
Let’s consider Sanctuary’s story. This association topped last year’s league table, completing an impressive 3,154 homes. This year it’s in third place on 1,414 completions.
“That’s the tail end of the 2011/15 programme. We had about 2,500 completions in one year,” explains Peter Martin, development director at Sanctuary.
It’s a cycle that Sanctuary is keen to smooth out in future, and is targeting 3,000 homes a year after its proposed merger with Housing & Care 21. “We want it done consistently,” he says.
The specialist older people’s association dropped out of the Top 50 this year, although it was the ninth-biggest builder last year.
Bruce Moore, Housing & Care 21 chief executive, points out though: “2014/15 was an exceptional year for us in terms of development.
“That was, however, in part because our development programme had been delayed, so the majority of the three-year programme was delivered in that year. It was never in the plan for this level of development to be sustained into 2015/16, because we are now in the process of rebuilding our development pipeline.
“Going forward, one of the main reasons for our proposed merger with Sanctuary is that we want to significantly increase our development output.”
The rise of market sale and private rent
Housing associations have discussed the need to build more homes for market sale for years, but for the first time that has translated into a major increase in completions.
Last year, 2,989 (or 8%) of homes completed by the Top 50 were for sale on the open market. But in 2015/16, this rose to 5,029 (or 15%).
L&Q built the most - 623 (see table, above) - followed by Places for People’s 504 for market sale, making this the association’s biggest single tenure. (And contributing to an overall increase in its completions, which has pushed it into the Top 10 Biggest Builders.)
Of course, these inroads into the market do bring risks when the sector has historically been ‘counter-cyclical’, meaning it has built during recessions in the housing market. And at time of writing, the news of Brexit was just sinking in. Hometrack was warning of a “rapid deceleration in house price growth”. One way to diffuse that risk might be to build in the private rented sector. And building for private rent is also rising - although only 13 associations completed homes in this tenure.
Places for People’s development director, Colin Rae, says: “The direction of travel was to make sure we had a business that was both cyclical and counter-cyclical. We still have significant housing need and that will prevail regardless of what happens in the economy.”
David Bogle is chief executive of Hightown, which had the largest organic growth in the sector at 7.8%. “A development programme is risky - compared to doing nothing,” he points out.
Top 10 building the most for market sale
| Housing association | From 1 April 2015 to 31 March 2016, how many new homes of any tenure did you complete? | How many were market sale? |
|---|---|---|
| L&Q | 2,491 | 623 |
| Places for People Group | 1,119 | 504 |
| A2Dominion | 1,127 | 330 |
| Anchor | 314 | 314 |
| Affinity Sutton | 1,139 | 269 |
| Network Homes | 387 | 239 |
| Peabody | 1,080 | 236 |
| Guinness Partnership | 908 | 223 |
| Orbit Group | 1,765 | 222 |
| One Housing Group | 337 | 217 |
Raising the stakes
Network Homes has a similar tale of grant cycles to explain its drop from fifth place last year to 33rd. Vicky Savage, its development director, calls 2014/15 “a big, bumper year”, as the association strove to complete homes in time for the Homes and Communities Agency’s (HCA’s) drop-dead date. “Since that time, we’ve been building on our pipeline,” she adds. Indeed, the association started onsite with 747 homes in 2015/16, bearing this out.
Then there is the unknown factor of Your Housing Group - which completed 1,018 homes in 2014/15, making it the 13th biggest builder of 2015. The association does not appear in our league table. Alone out of more than 100 housing associations, Your Housing refused to send details of its completions or pipeline this year, so it is impossible for us to know what has happened to its performance. Its chief executive Brian Cronin issued a statement, saying: “The sector has changed, and as such we are no longer developing in the same way or on the same scale. We are reshaping and redefining our proposition, and part of that work is taking a close look at our development mix for the future.” However, this would have had no bearing on the association’s ranking, as the Top 50 is compiled by examining homes already completed.
Many housing associations also told Inside Housing they’ve been affected by skills shortages in the construction sector. Mr Martin of Sanctuary lists as his main concerns “controlling costs and availability of labour - one is driven by the other”.
A number of landlords are responding to this challenge as well. Swan, for example, set up an in-house construction team about eight years ago. “It’s given us more visibility on costs,” says the association’s Mr Pearce. “It’s a bit cheaper, because we’re not paying a contractor’s profits, which can be 8-10%.”
Bucking the trend, many associations are still making big gains in the league table despite grant cycles and policy changes.
Stonewater has one of the most dramatic stories to tell. Last year, it squeaked into the league table in 48th place, building 385 homes. This year, it has jumped to 17th place, after nearly doubling its completions to 650 homes.
Jonathan Layzell, its executive director for development, explains this is the result of plans set in motion last year, when the landlord was formed from the merger of Raglan and Jephson, with the specific intention of boosting the number of homes built. “There was always an absolute commitment from the board that we would ramp up development and this is us delivering that,” he says.
Adactus has made a similar leap, from 47th to 19th place, by increasing completions from 405 to 625. It also appears in our top 10 associations growing their stock the most (see table), increasing its size by 4.8%. Its chief executive, Paul Lees, points out that it has managed to grow its development programme based on a 25% surplus. “That gives us a greater ability to invest,” he says.
The future for social rent
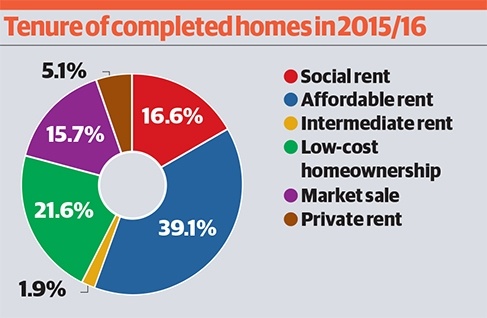
Social rent held its own this year - perhaps surprisingly, completions have stayed roughly at the same level year-on-year, and crept up as a percentage (from 14% to 17%).
Grant for sub-market rent is falling away in England - leaving housing associations to cross-subsidise if they want to build, or focused on Right to Buy replacements. But it also cuts the strings binding landlords to more expensive affordable rent.
Could some decide to cross-subsidise at social rents, reinvigorating this tenure? Some certainly talk of ‘rents that are affordable’, as distinguished from rents set at 80% of market levels.
Additionally, there is Scotland. The government in Holyrood has a healthy grant programme for social rent, and ambitious targets for 50,000 homes to be built by the end of the parliament.
The rise of Scottish building can be seen in the Top 50 already - Wheatley Group, the biggest social landlord in the country, has risen from 38th place into the Top 10, roughly doubling its building.
Unsurprisingly, as affordable rent does not exist in Scotland, Wheatley is also the biggest developer for social rent (see table).
The driver for this, says David Fletcher, Wheatley’s group director of regeneration, is: “The obvious: the ongoing, unmet demand and need for affordable homes in communities across Scotland.” But more specifically the landlord has been spending the £300m it raised on the bond market in 2014/15, and says that it intends to go to the capital markets again in future.
Scotland-based Link Group also appears in our Top 50 by pipeline this year for the first time.
Top 10 building the most for social rent
| Housing association | From 1 April 2015 to 31 March 2016 how many new homes of any tenure did you complete? | How many were for social rent? |
|---|---|---|
| Wheatley Group | 983 | 668 |
| L&Q | 2,491 | 483 |
| Orbit Group | 1,765 | 417 |
| Sanctuary Group | 1,414 | 297 |
| Sovereign | 937 | 268 |
| A2Dominion | 1,127 | 240 |
| Swan | 420 | 226 |
| Fortis Living | 353 | 212 |
| Places for People Group | 1,119 | 170 |
| Stonewater | 650 | 162 |
Swan is the highest new entrant this year. Geoff Pearce, its executive director of regeneration and development, explains the last few years the association has been focused on delivering a pipeline of about 3,500 homes - in the form of major London regeneration projects, and land that had been banked.
If this year’s figures are down, what about the future pipeline? Looking at our Top 50 by pipeline (see table), we expect a modest rise next year to 34,326 homes completed by these associations. But by 2020, we expect them to add 175,038 homes to Britain’s housing stock.
This is broadly in line with what we predicted in our mid-year check-in with the Top 50 (‘The development rollercoaster’, Inside Housing, 18 March 2016). However, the development pipeline seems to be shifting into later years. Back in March, the Top 50 expected most of those homes to be built by 2018, with more than 106,000 in the next two years, followed by just over 68,000 in 2018/20.
By the time of our full survey, this has changed - the Top 50 by pipeline expects to deliver nearly 79,000 homes in 2016/18, but then another 96,000 in the last two years of the decade. How these numbers might change again in the light of the exit of the UK from the EU is not yet possible to determine. Ms Emmett from Savills says: “We expect to see a slowdown in house price growth and the number of homes traded. That said, the requirement for homes in many parts of the country will still exceed supply. The urgency to meet housing need remains.”
Market turmoil can now affect sub-market rent building, as landlords cross-subsidise developments. Orbit is second in the Top 50 and the only large association to make our list of the associations growing the most by percentage. Its property investment director, Paul High, points out the connection: “Certainly for sub-market rent, it will be reliant on the profits we can make as an organisation.”
Another risk factor is Section 106 - this planning requirement has provided housing associations with a steady supply of homes for years. But with government set to deliver Starter Homes via this mechanism in future, what will this do to the pipeline? To find out, we asked housing associations to estimate how much of their pipeline will come from Section 106. The answer - with plenty of caveats and acknowledgement that these figures could change - is that 53,187 of the homes in the 2016/20 pipeline are due to come from Section 106. Some deals will have already been secured, but changes to this planning requirement leave another question mark over future delivery by the sector.
Low-cost homeownership
Homeownership is the future - at least according to the government in Westminster. The grant programme is switching almost entirely to support shared ownership in England, with the Starter Homes programme hot on the heels of policies like Help to Buy. As grant switches track, what role will housing associations play?
This year, the number of low-cost homeownership homes completed by the Top 50 has actually dropped, from 8,243 last year, to 6,911 in 2015/16. (Although the proportions have stayed roughly the same - at about one in five of homes built.)
Appetite among the Top 50 for more shared ownership is mixed. Jerome Geoghegan, development director at L&Q, says: “We haven’t yet fixed our appetite. I would fully expect us to be bidding for it.”
But this is another market sale product, and landlords are increasingly exposed. “Obviously we’re watching what’s happening at the higher end of the market - we’re seeing values coming off the top,” Mr Geoghegan adds.
This change in grant is likely to have a dramatic impact in future years. Adactus, for example, is soaring this year based on generous surpluses.
But “come 2018, at present our programme is going to be cut by about half” says chief executive Mr Lees, who at time of speaking to Inside Housing was days from a board meeting where the organisation would decide on its bid for the shared ownership grant programme.
When we asked how many shared ownership homes the Top 50 expect to build in the 2016/21 programme funded by the Homes and Communities Agency, many couldn’t yet tell us, and lots of the figures were marked as provisional.
However, the Top 50 by pipeline is so far contemplating bids that total 33,568. That leaves a substantial gap to be filled if the government is to reach its target - of 135,000.
Monitoring mergers
And then there is the elephant in the room: the mega-mergers. Many of the Biggest Builders this year are on the verge of joining hands, including our top player, L&Q. For that reason, the numbers given to us by these organisations are by necessity provisional.
To give just one example, Affinity Sutton says: “These figures are based on our current business plan. We are, however, in merger discussions with Circle Housing Group, and should we become a merged organisation we have the ambition to deliver 5,000 new homes annually, with 50,000 homes being built in the 10 years from 2019. This is some 30,000 more homes than the planned output of the two individual groups. We would expect the new group to be one of the country’s largest house builders.”
We can’t yet predict what the impact will be - if all the mergers go ahead. Keep an eye out for next year’s Top 50 - things are about to get interesting.


