You are viewing 1 of your 1 free articles

The social rent dilemma
Housing associations have long been accused of abandoning social rent to build more commercial tenures. But is this really the case? And how are some still building homes for social rent? William Hatchett takes a look beyond the numbers. Illustration by Jon Heal
A crude measure of a housing association’s success is the number of homes it is building – a tangible indication of its contribution to alleviating the housing crisis.
Inside Housing’s annual survey of the country’s largest housing developers always generates a buzz of excitement. Understandably, attention tends to focus on those which have built the highest number of new homes.
But each year, vital questions are raised. Critics say the larger associations have become too big and some accuse them of forgetting their social purpose, a charge they vigorously deny. Given the sector’s charitable purpose, should we measure success not in overall numbers, but in terms of how many truly affordable homes these organisations are building?
Most of the big developers would argue that it is impossible to deliver sub-market housing without also building homes for sale: they could not afford to build affordable schemes without subsidising them with market housing.
But their critics still point to the dwindling supply of social rent housing as an indicator of the sector’s failure. So who is right? Or is the real picture more complicated?
The best way to find out is to examine the numbers in more detail. The latest figures from Homes England show that of 45,692 homes started on site in 2018/19 through its various programmes, 30,563 – or 67% of the total – were affordable homes. That is the highest number for four years, according to the government.
But what does ‘affordable’ mean in this context? Of these 30,563 units, around 58% are for affordable rent, defined as up to 80% of market rent.
READ MORE


Of the remainder, 38% are made up of intermediate affordable housing. This is defined as “homes for rent and sale provided at a cost above social rent, but below market levels”. That leaves only 4% of the programme devoted to social rent, determined by local income levels and property size and value. There were only 1,231 starts of homes for social rent in 2018/19, down by 12% on 1,406 the year before.
Social rent once dominated the Affordable Housing Programme, providing more than 50,000 units in 1992-93. Now it makes up only a tiny proportion, while intermediate rent and low-cost homeownership have hugely increased. Under the new Conservative government, social rent is set to continue to be a bit-part player, if the party’s manifesto is anything to go by.
The number one reason that associations find it harder to build social rent homes is, of course, grant. A report commissioned by Network Homes and published in January last year found that associations received an average of £33,600 in grant per home under the Affordable Homes Programme 2015-18, compared with £102,641 in 2008-11. With build costs going up, that clearly means that these homes have to generate more income.
“We are focused on building as many affordable homes as we can”
Guy Slocombe, chief investment officer, Hyde
Nevertheless, there are still a range of solutions that providers offer to this dilemma. Of the 50 associations doing the most development, what proportion of their programmes are given over to social rented housing?
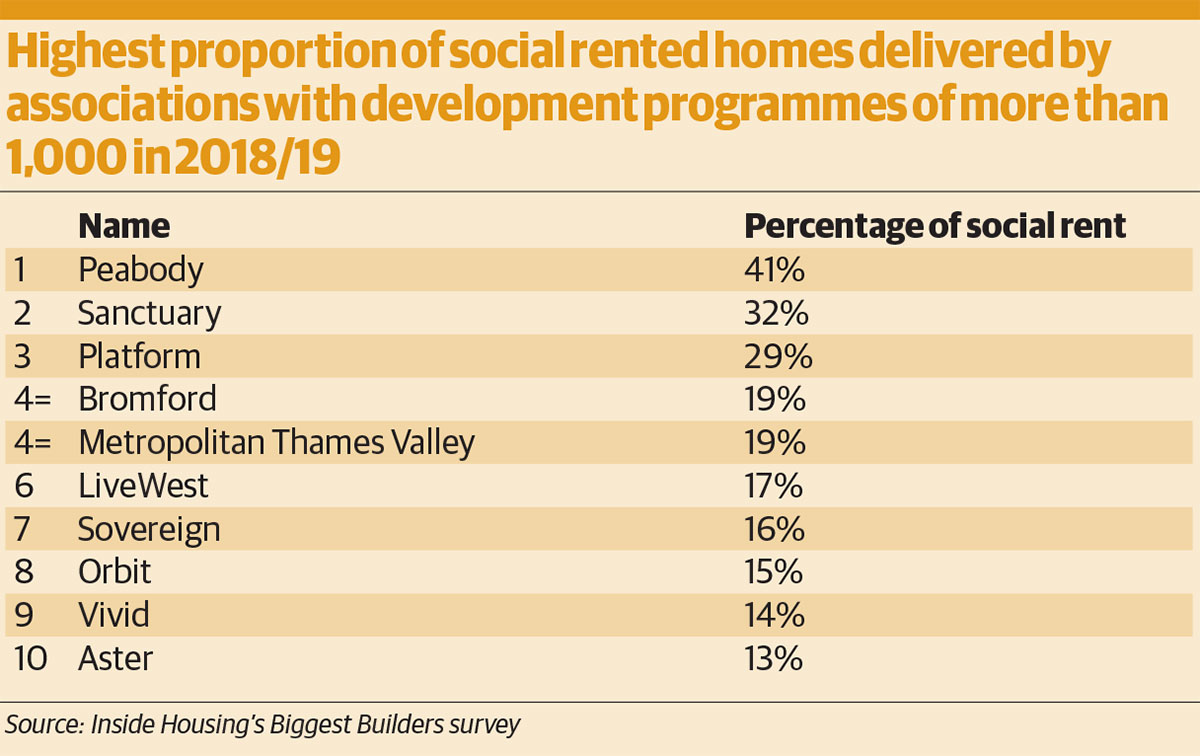
The tables show the proportion of new housing in 2018-19 from the ‘top 50 builders’ devoted to social rent. Among the associations with large overall programmes, Peabody heads this list, with 41% of its programme earmarked as social rent. Sanctuary and Platform are the next best by this measure, out of all associations that built at least 1,000 total homes.
For associations that built less than 1,000 homes last year the percentages are even higher. Scottish-based Wheatley, the UK’s fifth-largest housing association by stock total, achieved a remarkable 71% as social rent. There is a very significant caveat here, however: Wheatley’s output is funded by the Scottish government and benefits from generous grant rates. The Scottish government’s £3.3bn More Homes policy promises to deliver 50,000 affordable homes by March 2021, of which 35,000 will be for social rent.
On the flip side, some housing associations built very few social homes. Of the 1,660 homes which Home Group completed, just four were for social rent, although 554 were for low-cost homeownership.
However, Home Group tells Inside Housing that 73% of its total 55,000 homes are social rent homes, and that it charges affordable rent at 65% of average market rent where it operates.
For Hyde, the proportion of social rent delivered last year was just 6%. But the group’s chief investment officer Guy Slocombe says its “strategy focuses on delivering mixed-tenure sustainable communities and we will always include, where possible and appropriate, private sale homes within our programme”. He adds: “We are focused on building as many affordable homes as we can.”
“I can show you large uncaring organisations and small uncaring ones. It has nothing to do with size.”
This year, the top 50 associations collectively built just over 38,000 homes – an increase of 8% on the previous year, against a £43m fall in government grant to around £6bn. There was a small rise of 6.5% in the number of social rent homes built, but a huge 21% increase in the development of low-cost homeownership properties.
Bromford, which built 19% of its programme for social rent, has an aspiration to be in, or close to, the top five developing housing associations in the next two or three years, according to its chief investment officer, Martyn Blackman. The landlord merged with Merlin last year, and was boosted in January by being selected as one of Homes England’s strategic partners.
This, Mr Blackman says, will add £66.4m and 1,400 homes to the association’s development programme, which is currently valued at up to £250m over the next five years. Bromford has raised £450m in bond issues over the past 18 months to fund its ambitions.
Often, the tenure mix of a new build scheme is determined by Section 106 agreements, Mr Blackman explains. In some cases, the objective is to create mixed communities, as well as to ensure affordability. But affordability is always important.
“We know there are lots of people in housing need across our area and that’s a challenge,” he says. “We tend to cap affordable rents at Local Housing Allowance (LHA) levels. We are clear in our strategy that our core business is to provide affordable homes – that’s what we are here for.”
Next to Bromford in the top 50 is South of England-based Aster Group, which built 13% of its programme for social rent. Amanda Williams, its group development director, explains the association’s business model: “At the moment we predominantly work through Section 106, but we are intending to make our land-led business a larger part of our programme and to increase shared ownership.”
She says that Aster is involved in an increasing amount of development with community land trusts: “It’s a great way of delivering affordable housing that local people want.”
Like Bromford, Aster pegs affordable rents to LHA. Ms Williams says: “We haven’t seen any sign of a dip in the value or volume of shared ownership.” Group finance director Chris Benn is confident that the company can deliver at least 10,000 new homes in the next seven years – a significant programme for an association of its size.
Brendan Sarsfield, chief executive of Peabody, disagrees with the ‘big is bad’ premise. The landlord manages nearly 60,000 homes in London and Essex but delivers a high proportion of its programme as ‘affordable’.
He says: “I can show you large uncaring organisations and small uncaring ones. It has nothing to do with size.”
Neither does being good at business contradict the organisation’s social responsibility, he says. “To charge low rents, we have to be very financially savvy and the more homes we want to create, the more savvy we have to be. The good thing is, this whole organisation believes that delivering low rents is important.”
Peabody’s affordable rents are equivalent to council rents in its local areas. The association’s 2019 development programme of 1,104 homes is set to increase over the next two years.
The same is true of L&Q, which has been at the head of Inside Housing’s Top 50 Biggest Builders for the past five years. Fiona Fletcher-Smith, its group director of development and sales, anticipates development greater than the association’s 2,862 units in 2018/19 until the end of 2021. After that, she admits it is hard to predict what the future might hold.
Outright sale and market rent make up a combined 45% of L&Q’s 2018-19 programme. When asked about the high proportion of commercial tenures, Ms Fletcher-Smith points out that housing associations have been using the cross-subsidy model to compensate for lower grants since the late 1980s.
When the economy is buoyant, this model works, but the housing market fluctuates. In the past two years, the inner-London market has been sluggish. In September, L&Q announced that it was pausing on buying new land. The association has instead made substantial investments of more than £60m in enhancing fire safety across its properties in the wake of the Grenfell Tower fire.
Ms Fletcher-Smith says: “We will not compromise on residents’ safety. Yes, we are very proud to be one of the biggest developers in the country but if we slip down out of the top 10 and we’re keeping our people safe, I’d still be happy.”

In its manifesto, the Conservatives promised a new affordable housing funding programme, while associations have also committed to ramping up development: this financial year, 42,278 completions are predicted, rising to an average of 48,000 per year until 2022.
And yet there is a gloomy feeling in the sector that both politicians and developers could be over-promising – the UK’s cooling economy means that the sums just do not add up. A crunch is coming; it is just a matter of when.
Ms Fletcher-Smith sums up the mood: “We’ve come to a cliff edge. If the government wants any kind of affordable housing at scale, the output they want is unachievable on the current level of subsidy.
“They think that everybody can afford to own their home, but that just isn’t the case. The average L&Q tenant has an income of £13,000 a year. You can’t afford to buy on that in the areas where we work.”
London is not like the rest of England but the capital’s market slowdown is creeping north and west. Her words may soon be echoed in other regions.
But it does seem that even the largest housing associations have not forgotten their roots and are still delivering a proportion of social homes in the face of ever-decreasing grant.
At the moment, the cross-subsidy model works because there is a strong demand in most areas for both market rent and low-cost homeownership, but how long that will last is up for debate.
Many people in the sector believe that unless the post-Brexit housing market picks up, it will be impossible for associations to deliver large numbers of affordable homes of any kind without grant being greatly increased from last year’s £6bn. Meanwhile, the government’s predilection for new forms of equity purchase and shared ownership – at the expense of social rent – is set to continue.
And if it does, what many consider to be ‘truly affordable’ could become increasingly elusive.
Top 50 Biggest Builders 2019: most completions by tenure
Click any of the columns below to see how each organisation ranks
| Housing association | Total completions 2018/2019 | 2019 rank by total completions (2018 rank) | Social rent | Affordable rent | Intermediate rent product | Low-cost ownership homes | Market sale | Private rent | Total number of homes managed | Total investment | Total government grant | Notes |
|---|---|---|---|---|---|---|---|---|---|---|---|---|
| L&Q | 2,862 | 1 (1) | 255 | 641 | 29 | 657 | 757 | 523 | 95,000 | £954.2m | £26.2m | |
| Places for People | 1,876 | 2 (2) | 212 | 401 | 34 | 204 | 696 | 329 | 197,884 | |||
| Notting Hill Genesis | 1,856 | 3 (8) | 183 | 241 | 0 | 617 | 95 | 720 | 64,648 | £658.0m | £17.2m | |
| Home Group | 1,660 | 4 (5) | 4 | 731 | 0 | 554 | 371 | 0 | 55,000 | £29.0m | ||
| Platform Housing Group | 1,598 | 5 (20/19) | 458 | 681 | 0 | 459 | 0 | 0 | 46,000 | £228.5m | £22.4m | Formed from a merger between Fortis Living and Waterloo Housing in October 2018 |
| Sovereign | 1,543 | 6 (7) | 241 | 639 | 0 | 530 | 70 | 0 | 58,885 | £239.5m | £6.6m | Includes 63 homes developed for third parties |
| Orbit | 1,266 | 7 (3) | 189 | 544 | 0 | 343 | 190 | 0 | 43,000 | £205.0m | £15m | Includes 160 homes developed for third parties |
| Clarion | 1,243 | 8 (6) | 13 | 641 | 0 | 454 | 135 | 0 | 125,000 | £243.0m | £6.8m | |
| Bromford | 1,236 | 9 (13) | 240 | 501 | 30 | 431 | 34 | 0 | 44,000 | £2.1m | Completed a merger with Merlin in July 2017 | |
| Aster | 1,156 | 10 (12) | 156 | 444 | 0 | 453 | 103 | 0 | 31,522 | £178.0m | £2.1m | |
| Sanctuary | 1,128 | 11 (15) | 356 | 240 | 134 | 130 | 142 | 0 | 101,218 | £160.4m | £41.0m | Includes 126 care home bed spaces |
| Peabody | 1,104 | 12 (10) | 427 | 69 | 14 | 306 | 227 | 61 | 56,173 | |||
| Metropolitan Thames Valley | 1,037 | 13 (23/26) | 192 | 143 | 0 | 572 | 119 | 11 | 57,043 | £255.0m | £15.2m | Formed from a merger between Metropolitan and Thames Valley Housing in October 2018 |
| LiveWest | 1,015 | 14 (11) | 175 | 459 | 0 | 266 | 111 | 4 | 37,403 | £126.0m | £16.7m | Changed name from Liverty in August 2018 |
| Hyde | 1,006 | 15 (4) | 64 | 212 | 0 | 248 | 482 | 0 | 50,000 | £0 | £0 | |
| Vivid | 1,005 | 16 (17) | 144 | 301 | 0 | 312 | 162 | 86 | 30,521 | £164.0m | £4.0m | |
| Optivo | 985 | 17 (33) | 37 | 503 | 28 | 417 | 0 | 0 | 44,000 | £221.0m | £16.6m | |
| Wheatley | 896 | 18 (16) | 640 | 240 | 0 | 0 | 0 | 16 | 80,000 | £114.4m | ||
| A2Dominion | 875 | 19 (9) | 24 | 113 | 0 | 88 | 354 | 296 | 38,162 | £39.0m | £3.0m | |
| Radian | 666 | 20 (28) | 1 | 238 | 0 | 259 | 25 | 143 | 21,866 | £136.1m | £7.5m | |
| BPHA | 627 | 21 (37) | 91 | 339 | 0 | 191 | 6 | 0 | 18,721 | £122.7m | £3.5m | |
| Riverside | 600 | 22 (18) | 0 | 255 | 0 | 135 | 210 | 0 | 56,109 | £72.2m | £4.4m | |
| Longhurst | 580 | 23 (31) | 3 | 127 | 121 | 252 | 59 | 18 | 23,198 | £70.2m | £1.6m | |
| Catalyst | 560 | 24 (29) | 73 | 233 | 0 | 170 | 84 | 0 | 21,000 | £112.5m | £7.4m | |
| Jigsaw | 556 | 25 (14) | 52 | 305 | 0 | 105 | 27 | 67 | 34,000 | £53.0m | £15.0m | |
| WHG | 551 | 26 (20) | 168 | 169 | 0 | 214 | 0 | 0 | 20,451 | £66.5m | £7.3m | |
| Guinness Partnership | 501 | 27 (38) | 9 | 349 | 0 | 143 | 0 | 0 | 65,000 | £120.0m | ||
| Moat Homes | 500 | 28 (34) | 0 | 200 | 0 | 300 | 0 | 0 | 21,164 | £112.8m | £2.2m | |
| Together | 493 | 29 (35) | 0 | 455 | 0 | 38 | 0 | 0 | 36,000 | |||
| Network | 481 | 30 (32) | 10 | 223 | 0 | 237 | 11 | 0 | 18,093 | £10.4m | ||
| Torus | 454 | 31 (new) | 3 | 228 | 0 | 208 | 0 | 18 | 37,000 | £56.8m | £855k | Merged with Liverpool Mutual Homes in January 2019 |
| Midland Heart | 450 | 32 (46) | 32 | 228 | 0 | 111 | 79 | 0 | 33,000 | £57.6m | £5.5m | |
| Flagship | 436 | 33 (new) | 0 | 0 | 346 | 82 | 8 | 0 | 28,000 | Merged with Victory Housing Trust in January 2019 | ||
| Southern | 409 | 34 (new) | 73 | 15 | 0 | 185 | 88 | 48 | 28,221 | |||
| EMH Group | 400 | 35 (42) | 29 | 221 | 7 | 143 | 0 | 0 | 20,000 | £47.8m | £6.0m | |
| Karbon Homes | 394 | 36 (39) | 0 | 221 | 0 | 162 | 0 | 11 | 26,000 | £48.8m | £9.7m | |
| Thirteen | 393 | 37 (new) | 0 | 209 | 0 | 133 | 51 | 0 | 34,000 | £40.0m | £12.2m | |
| Cross Keys | 376 | 38 (35) | 0 | 213 | 0 | 163 | 0 | 0 | 11,464 | £53.7m | £1.8m | |
| Paradigm | 350 | 39 (25) | 34 | 120 | 0 | 196 | 0 | 0 | 14,911 | £76.0m | £653k | |
| CHP | 330 | 40 (41) | 0 | 212 | 0 | 118 | 0 | 0 | 9,910 | £54.4m | ||
| One Housing | 328 | 41 (22) | 0 | 93 | 0 | 74 | 155 | 6 | 17,047 | £123.2m | £1.0m | |
| Yorkshire Housing | 313 | 42 (50) | 79 | 102 | 8 | 97 | 27 | 0 | 16,850 | £29.1m | £8.7m | |
| Grand Union | 296 | 43 (49) | 9 | 199 | 0 | 87 | 0 | 1 | 12,417 | £37.0m | £716k | |
| Nottingham Community | 292 | 44 (44) | 29 | 168 | 0 | 86 | 9 | 0 | 9,628 | £35.8m | £3.6m | |
| Great Places | 281 | 45 (43) | 0 | 112 | 0 | 114 | 55 | 0 | 19,227 | £47.8m | £3.8m | |
| GreenSquare | 240 | 46 (new) | 43 | 100 | 0 | 93 | 4 | 0 | 12,056 | |||
| Accord | 239 | 47 (new) | 0 | 194 | 0 | 0 | 0 | 0 | 13,277 | Includes 45 extra care units | ||
| Wrekin Housing Group | 235 | 48 (27) | 11 | 163 | 59 | 2 | 0 | 0 | 12,500 | £24.5m | £3.8m | |
| Futures | 230 | 49 (new) | 11 | 73 | 0 | 51 | 7 | 88 | 9,800 | £33.4m | £1.5m | |
| Soha | 229 | 50 (new) | 2 | 169 | 0 | 58 | 0 | 0 | 6,617 | £35.0m | £962k |
Dash indicates figure was not supplied


