You are viewing 1 of your 1 free articles
Top 50 Biggest Builders 2020
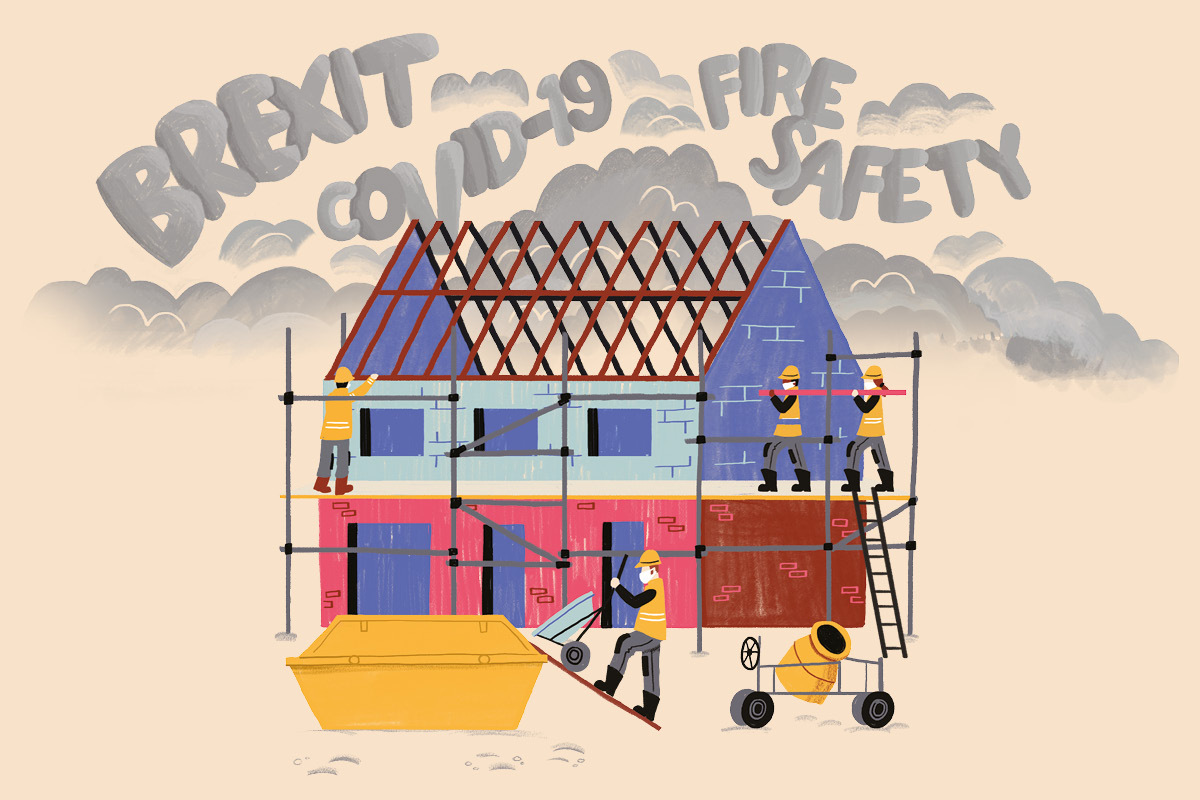
Which housing associations built the most homes? Which have the biggest pipelines? And will their plans survive the oncoming storm of external events? Jess McCabe reports. Illustration by Liz Kay
If it wasn’t for COVID-19, the story of this year’s Biggest Builders would be a very different one. We would be celebrating the record delivery of homes by our league table of the 50 housing associations building the most in the UK, despite some extremely challenging market conditions and the looming shadow of Brexit.
“It’s just a delay for us. In five years’ time we want to be starting 10,000 homes a year”
They completed a combined 40,681 homes in the year – up by more than 10,000 from just four years ago. Housing associations invested £6.6bn in building these homes, of which only £488m (or about 7.4%) was grant.
READ MORE


But, of course, that is not where we are at. Those numbers now look like they are just telling us about the last year of construction untouched by a pandemic with far-reaching implications. A few associations were hit by delays to nearly finished projects that were due to be handed over at the end of March, which we will get into below. But largely these are the homes built in the last year BC – or ‘before COVID-19’.
“COVID isn’t going to stop being a problem tomorrow, or next month or even next year”
What comes next? Inside Housing has some data for you here that may give some comfort and intelligence on what is happening in the development teams of housing associations. But the truth is that we do not know.
For the first time ever, our table of the housing associations with the biggest pipelines is peppered with blank entries – some of the biggest associations with the boldest development programmes would not even hazard a guess at some of the survey questions. Other figures are caged with caveats.
“I’m afraid we are unable to answer as we are continuing to assess the impact of COVID-19 on our business plan,” says Notting Hill Genesis, in a typical response.
Our pipeline league table does not include L&Q, because that housing association would not even estimate the number of homes it will be able to complete in this financial year (April 2020 to March 2021), let alone provide figures going out five years into the future. L&Q built the second-most homes last year and it has been ranked first or second in the table for a decade, so that is an indication of just how uncertain these times are.
To be clear, it is not a criticism of these organisations that they have not provided figures, but a signal of the historic uncertainty of this era.
Top 50 Biggest Builders 2020: most completions by tenure
Click any of the columns below to see how each organisation ranks
Totals | 2,031,016 | 40,681 |
| 5,727 | 12,946 | 960 | 12,261 | 7,388 | 1,246 | £6.6bn | £488.3m |
| Housing association | Number of homes | Total completions 2019/20 | 2019 rank by total completions (2018 rank) | Social rent | Affordable rent | Intermediate rent product | Low-cost ownership | Market sale | Private rent | Total investment | Total government grant |
|---|---|---|---|---|---|---|---|---|---|---|---|
Places for People | 209,312 | 2,680 | 1 (2) | 345 | 695 | 1 | 425 | 887 | 327 | n/a | n/a |
L&Q | 104,663 | 2,433 | 2 (1) | 199 | 411 | 90 | 488 | 1068 | 177 | £806.1m | £35.1m |
Clarion | 125,000 | 2,101 | 3 (8) | 198 | 729 | 0 | 883 | 291 | 0 | £565.0m | n/a |
Notting Hill Genesis | 66,453 | 1,846 | 4 (3) | 207 | 213 | 27 | 547 | 459 | 393 | £831.4m | £23.8m |
Sovereign | 60,000 | 1,773 | 5 (6) | 245 | 780 | 0 | 677 | 71 | 0 | £398.0m | £49.0m |
Orbit | 44,753 | 1,520 | 6 (7) | 120 | 455 | 0 | 594 | 287 | 64 | n/a | n/a |
Platform | 47,000 | 1,448 | 7 (5) | 523 | 438 | 0 | 487 | 0 | 0 | £257.7m | £18.5m |
Vivid | 31,469 | 1,372 | 8 (16) | 202 | 333 | 0 | 408 | 355 | 74 | £269.0m | £12.7m |
LiveWest | 37,399 | 1,245 | 9 (14) | 289 | 494 | 0 | 375 | 87 | 0 | £169.0m | £21.3m |
Metropolitan Thames Valley | 57,500 | 1,236 | 10 (13) | 45 | 229 | 0 | 507 | 455 | 0 | £345.0m | £14.3m |
Home Group | 55,000 | 1,167 | 11 (4) | 8 | 611 | 0 | 207 | 341 | 0 | n/a | n/a |
Aster | 31,420 | 1,067 | 12 (10) | 97 | 427 | 0 | 431 | 112 | 0 | £212.0m | £12.5m |
Peabody | 66,000 | 1,048 | 13 (12) | 388 | 38 | 8 | 400 | 214 | 0 | n/a | n/a |
Bromford1 | 44,000 | 1,027 | 14 (9) | 320 | 316 | 0 | 318 | 58 | 0 | £171.0m | £14.4m |
Riverside | 58,000 | 894 | 15 (22) | 0 | 457 | 0 | 181 | 256 | 0 | £122.2m | £17.5m |
Sanctuary | 102,686 | 816 | 16 (11) | 205 | 252 | 10 | 168 | 181 | 0 | £133.7m | £30.2m |
Wheatley | 93,000 | 802 | 17 (18) | 601 | 197 | 0 | 4 | 0 | 0 | £108.6m | £52.1m |
Catalyst | 32,000 | 787 | 18 (24) | 160 | 158 | 0 | 277 | 192 | 0 | n/a | n/a |
Swan | 10,899 | 708 | 19 (new) | 36 | 36 | 0 | 260 | 376 | 0 | £237.0m | £8.4m |
Optivo | 45,000 | 693 | 20 (17) | 20 | 369 | 0 | 299 | 5 | 0 | £182.9m | £8.5m |
Hyde | 44,372 | 687 | 21 (15) | 38 | 62 | 1 | 98 | 488 | 0 | n/a | n/a |
BPHA | 19,235 | 661 | 22 (21) | 68 | 356 | 10 | 227 | 0 | 0 | £87.5m | £7.1m |
Stonewater | 32,607 | 654 | 23 (new) | 76 | 329 | 0 | 249 | 0 | 0 | £102.0m | £8.3m |
Torus | 40,000 | 649 | 24 (31) | 34 | 406 | 0 | 209 | 0 | 0 | £94.1m | £12.8m |
Flagship | 31,359 | 601 | 25 (33) | 0 | 0 | 449 | 130 | 22 | 0 | n/a | n/a |
Radian | 32,503 | 595 | 26 (20) | 29 | 260 | 0 | 239 | 50 | 17 | £40.0m | £4.4m |
Midland Heart | 33,000 | 570 | 27 (32) | 41 | 305 | 0 | 121 | 8 | 95 | n/a | n/a |
Longhurst | 23,462 | 568 | 28 (23) | 66 | 125 | 59 | 264 | 46 | 8 | £81.0m | £11.4m |
Yorkshire Housing | 18,000 | 553 | 29= (42) | 101 | 128 | 13 | 239 | 66 | 6 | £110.6m | £17.6m |
Moat | 20,874 | 553 | 29= (28) | 0 | 166 | 0 | 361 | 26 | 0 | £132.0m | £3.6m |
Karbon | 27,200 | 534 | 31 (36) | 17 | 168 | 208 | 85 | 41 | 15 | £74.2m | £10.8m |
Jigsaw | 34,000 | 532 | 32 (25) | 6 | 379 | 0 | 147 | 0 | 0 | £68.0m | £11.0m |
Hightown | 6,856 | 477 | 33 (new) | 12 | 294 | 44 | 120 | 0 | 0 | £128.0m | n/a |
Poplar Harca | 9,500 | 470 | 34 (new) | 114 | 114 | 0 | 77 | 165 | 0 | n/a | n/a |
EMH Group | 20,534 | 468 | 35 (35) | 16 | 278 | 0 | 174 | 0 | 0 | £68.0m | £9.7m |
WHG | 21,263 | 446 | 36 (26) | 96 | 202 | 0 | 148 | 0 | 0 | £55.6m | £10.7m |
Southern | 28,221 | 419 | 37 (34) | 14 | 113 | 0 | 155 | 73 | 64 | £144.3m | £7.3m |
Thirteen | 33,034 | 418 | 38 (37) | 16 | 299 | 0 | 97 | 6 | 0 | £51.7m | £9.5m |
One Housing | 14,453 | 410 | 39 (41) | 18 | 17 | 0 | 163 | 141 | 0 | n/a | n/a |
WDH | 32,078 | 402 | 40 (new) | 135 | 148 | 6 | 113 | 0 | 0 | £42.1m | £3.3m |
Paradigm | 15,214 | 399 | 41 (39) | 23 | 74 | 0 | 239 | 63 | 0 | £63.3m | £2.1m |
Citizen | 30,000 | 377 | 42 (new) | 84 | 174 | 0 | 104 | 15 | 0 | £51.7m | £5.6m |
CHP | 10,450 | 375 | 43 (40) | 7 | 291 | 0 | 76 | 0 | 1 | £60.1m | £5.3m |
Cross Keys Homes | 11,884 | 372 | 44 (38) | 21 | 187 | 0 | 164 | 0 | 0 | £62.9m | £800,000 |
Great Places | 24,119 | 319 | 45 (45) | 12 | 100 | 0 | 97 | 90 | 0 | £45.7m | £8.2m |
GreenSquare | 12,271 | 318 | 46 (46) | 26 | 163 | 0 | 101 | 28 | 0 | n/a | n/a |
A2Dominion2 | 38,148 | 310 | 47 (19) | 47 | 38 | 0 | 13 | 207 | 5 | £147.8m | £2.5m |
Coastline Housing3 | 4,913 | 302 | 48 (new) | 0 | 186 | 0 | 73 | 3 | 0 | £34.1m | £7.8m |
Housing Plus | 18,912 | 291 | 49 (new) | 138 | 73 | 0 | 80 | 0 | 0 | £30.0m | £940,000 |
Broadland | 5,180 | 288 | 50 (30) | 0 | 137 | 34 | 38 | 79 | 0 | £34.3m | £4.0m |
Source: Inside Housing survey
Notes: 1. Total includes 15 specialist homes for people with learning difficulties. 2. The association has excluded joint venture schemes for the purpose of this survey. 3. Forty homes were delivered in a joint venture with Legal & General.
So what do we know? On the face of it, the current financial year still looks strong. Even without L&Q, and all the caveats, the top 50 by pipeline expect to complete 38,996 homes this financial year. That would be a good result in any year. Those associations started 43,033 homes in 2019/20, so there is some reason to expect a significant level of delivery.
In the next two years, they expect to build 82,590 homes. In five years, they predict 199,387.
The equivalent five-year prediction in last year’s survey, however, was for more than 250,000. That is a staggering drop of 50,000 homes, and one that cannot be accounted for even by big players such as Clarion and L&Q being unable to provide numbers. Indeed, the figure could reduce further when even more associations reassess their pipelines, as some told us the figures have not yet been adjusted.
How much of that is a real reduction, and how much is caution and a conservative assessment? Let’s look at L&Q. Not only was the 95,500-home association absent from the league table, but in September last year it announced a pause in new development projects, citing “one of the most challenging environments in recent history”. And that was before coronavirus had even emerged.
However Fiona Fletcher-Smith, the association’s group director of development and sales, is relatively bullish. “It’s just a delay for us. In five years’ time we want to be starting 10,000 homes a year,” she says.
David Fletcher, director of development at Wheatley, makes a similar point – despite the longer shutdown of sites in Scotland. “We are still very much committed to our development programme and don’t think there will be any long-term effects on the pipeline,” he says.
Top 10 completions as proportion of stock
| Housing association | Number of homes owned/managed | Total homes of any tenure completed 2019/20 | Completions as proportion of stock |
|---|---|---|---|
Hightown | 6,856 | 477 | 7.0% |
Swan | 10,899 | 708 | 6.5% |
Coastline Housing | 4,913 | 302 | 6.1% |
Poplar Harca | 9,500 | 470 | 4.9% |
Leeds & Yorkshire | 1,588 | 72 | 4.5% |
United Welsh | 6,148 | 277 | 4.5% |
Vivid | 31,469 | 1,372 | 4.4% |
CHP | 10,450 | 375 | 3.6% |
Origin Housing | 6,937 | 247 | 3.6% |
BPHA | 19,235 | 661 | 3.4% |
Others are sounding a different note. Dick Mortimer, executive director of development at Peabody, says: “COVID isn’t going to stop being a problem tomorrow, or next month or even next year. That could affect our costs of development and the number of units we build out. We are going to see a slowdown in starts and we are going to see a slowdown in finishes.”
Peabody expects to build 1,144 homes this financial year, and 2,664 in the next two years. But the association, seventh in the pipeline league table, was unable to provide any five-year figures because of the uncertainty.
COVID-19 is not the end – or even the beginning – of the story of what is happening to housing association construction plans. Peabody, like L&Q and many associations, was already reassessing its pipeline. There were poor market conditions. But also, associations were still calculating how to pay for fire safety work identified after the Grenfell Tower disaster.
“COVID is a layer on top of a very difficult layer that was already in place before 23 March”
“That’s come straight out of the ability of us to do development. COVID is a layer on top of a very difficult layer that was already in place before 23 March,” Mr Mortimer notes – referring to the date lockdown officially began.
Network Homes is one of the associations whose completions were immediately hit – the association delivered 279 homes in 2019/20, meaning it falls out of the bottom of our league table. This is a 37% drop on what Network expected to do. David Gooch, executive director of development at the association, explains that several projects were due to finish right at the end of March. Many of those completed in July, a few months late.
But he says that the real impact of COVID-19 will be felt later. “What will happen is for things that you’re already in contract for there will be a managed delay. What’s more difficult is to set a firm timetable to enter into new commitments.”
On top of COVID-19, the sector has been coping with Brexit and the impact this is having and will have on everything from the availability of construction workers to the cost of materials being shipped from overseas.
Top 50 Biggest Builders 2020: pipeline
Click any of the columns below to see how each organisation ranks
Totals | 38,996 | 33,047 | 43,033 | 82,590 | 56,571 | 199,387 | 84,828 |
| Housing association | Number of homes expected to complete in 2020/21 | Number with site secured (ownership or options) | Number of starts in 2019/20 | Number of homes expected to complete in next two years | Number with site secured (ownership or option) | Number of homes expected to complete in next five years | Number with site secured (ownership or option) |
|---|---|---|---|---|---|---|---|
Places for People | 2,670 | 2,419 | 1,982 | 7,531 | 3,809 | 11,141 | 4,861 |
Notting Hill Genesis | 1,756 | 1,756 | 546 | n/a | n/a | n/a | n/a |
Sovereign1 | 1,751 | 1,392 | 1,392 | 3,400 | 2,344 | 9,500 | 2,927 |
Link Group2 | 1,654 | 1,630 | 342 | 2,142 | 1,895 | 3,125 | 2,266 |
Home Group3 | 1,536 | 0 | 1,062 | 3,394 | n/a | 8,262 | n/a |
Clarion13 | n/a | 0 | 2,572 | n/a | n/a | n/a | n/a |
Peabody4 | 1,144 | 1,108 | 2,357 | 2,664 | 2,528 | 2,664 | n/a |
Platform | 1,138 | 1,115 | 544 | 2,638 | 2,475 | 8,438 | 2,713 |
Bromford | 1,109 | 1,109 | 1,592 | 2,800 | 1,926 | 7,000 | 3,000 |
MTVH5 | 1,103 | 1,103 | 1,553 | 2,440 | 2,440 | 6,436 | 1 |
Aster | 1,078 | 1,017 | 937 | 2,885 | 2,022 | 7,228 | 2,806 |
Vivid | 1,049 | 1,030 | 1,819 | 2,907 | 2,421 | 5,680 | 3,974 |
Torus | 1,043 | 893 | 924 | 2,686 | 1,450 | 6,165 | 2,713 |
Sanctuary | 990 | 990 | 2,229 | 2,948 | n/a | 9,520 | n/a |
Stonewater | 958 | 853 | 816 | 2,615 | 1,714 | 5,240 | 2,547 |
Hyde | 910 | 910 | 1,042 | 1,685 | 1,685 | 5,815 | 5,294 |
A2Dominion6 | 900 | 900 | 1,044 | 1,800 | 1,800 | 4,500 | 4,500 |
Riverside | 827 | 765 | 774 | 2,087 | 1,351 | 6,019 | 1,572 |
Jigsaw7 | 750 | 660 | 1,008 | 1,550 | 700 | 3,950 | 1,000 |
Network Homes | 716 | 716 | 590 | 978 | 978 | 3,492 | 2,778 |
Guinness8 | 700 | 700 | 1,026 | 2,200 | 2,200 | 7,000 | 5,500 |
Moat | 688 | 668 | 424 | 1,215 | 1,119 | 3,250 | 1,227 |
LiveWest | 650 | 650 | 1,173 | 1,625 | 1,625 | 6,125 | 3,645 |
Midland Heart | 650 | 0 | 819 | 1,500 | n/a | 3,300 | n/a |
Yorkshire Housing | 650 | 650 | 797 | 1,737 | 1,500 | 2,350 | 1,482 |
Citizen | 625 | 597 | 517 | 1,205 | 659 | 3,798 | 597 |
Wheatley | 584 | 584 | 582 | 1,234 | 1,111 | 4,007 | 3,545 |
Great Places | 582 | 571 | 576 | 1,827 | 1,131 | 4,626 | 1,131 |
Radian9 | 581 | 490 | 819 | 2,252 | 1,359 | 5,072 | 2,048 |
Optivo10 | 571 | 571 | 1,500 | 1,684 | 1,587 | 3,162 | 2,962 |
Longhurst | 542 | 361 | 432 | 1,324 | 648 | 3,594 | 766 |
Karbon Homes | 531 | 345 | 857 | 1,260 | 887 | 2,700 | 1,300 |
Hightown | 528 | 512 | 414 | 1,235 | 961 | 2,224 | 1,664 |
EMH Group11 | 516 | 325 | 654 | 1,095 | 792 | 2,750 | 1,486 |
Flagship | 480 | 457 | 1,192 | 1,246 | 901 | 4,136 | 1,312 |
Cross Keys Homes12 | 460 | 432 | 358 | 819 | 610 | 1,003 | 797 |
WHG | 435 | 435 | 677 | 751 | 667 | 2,086 | 941 |
Housing Plus | 400 | 297 | 53 | 282 | 245 | 2,152 | 1,018 |
Catalyst | 387 | 387 | 608 | n/a | n/a | n/a | n/a |
Wales & West | 378 | 378 | 269 | 969 | 969 | 2,469 | 1,890 |
CHP | 285 | 285 | 339 | 650 | 568 | 1,745 | 720 |
GreenSquare | 367 | 0 | 297 | 757 | n/a | 1,827 | n/a |
PA Housing | 365 | 365 | 422 | 1,000 | 849 | 2,500 | 1,044 |
Together | 350 | 350 | 550 | 692 | 692 | 1,407 | 1,053 |
Nottingham Community | 350 | 302 | 363 | 931 | 771 | 1,223 | 854 |
WDH | 350 | 340 | 305 | 850 | 700 | 2,500 | 900 |
BPHA | 345 | 345 | 398 | 900 | 900 | 2,051 | 1,542 |
Origin | 343 | 298 | 224 | 525 | 298 | 1,350 | 298 |
Paradigm | 341 | 341 | 350 | 859 | 552 | 2,659 | 737 |
Wrekin | 325 | 235 | 362 | 891 | 725 | 2,391 | 937 |
Futures | 325 | 325 | 282 | 575 | 575 | 1,500 | 1,200 |
Source: Inside Housing survey
Notes: 1. Five-year programme is taken from last approved business plan. This is currently being revised. 2. The numbers quoted are as per business plan. 3. The forecasts provided were pre-COVID-19. 4. Pipeline plans are currently under review in light of the impact of the pandemic and additional commitment to building safety works. Figures for the five-year pipeline are therefore inclusive of only the next two years. 5. Subject to market conditions. 6. Excludes joint venture schemes for the purpose of this survey. Annual pipeline figures are internal targets and are subject to change depending on business and market conditions. 7. Figures are based on current development strategy and financial plan projections. They do not reflect the impact of the current situation and the inevitable delays as a result of the pandemic. 8. The pipeline numbers are entirely dependent on how COVID-19 impacts future delivery – the speed and strength of recovery of the property market will affect cross-subsidy levels and the availability of additional government funding for affordable housing. 9. Eighty-five starts are part of a joint venture. 10. In the process of reviewing the impact of COVID-19 on current programme and pipeline. Many sites were closed as a result and are starting to reopen. The forecast numbers submitted reflect the current expected impact on the association’s programme. 11. Please note that due to the current COVID-19 pandemic impacts, the forecasted figures are estimates and therefore subject to change. 12. Predicted pipeline is only publicly stated to March 2023 and not March 2025. 13. In a statement, Clarion said: “We are confident of building on the successful platform from 2019/20, but with the uncertainty created by the COVID-19 pandemic, we are not providing a target figure for completions for the next 12 months, two years, or five years.”
To add even more complexity to the picture, there is the need for decarbonisation. Housing associations told Inside Housing that this will affect their development pipelines in two ways.
First, by potentially increasing the costs of building (an announcement on this is due this year, COVID-19 delays notwithstanding, with the consultation suggesting that no new gas connections will be allowed from 2025, and energy efficiency standards will be significantly tougher).
Second, there is the murkier question of whether housing associations will have the money to build as much as they currently plan to, once they really start to grapple with the cost of upgrading their existing homes.
Top 10 associations building most low-cost homeownership homes
| Housing association | Total homes of any tenure completed 2019/20 | Of these, how many were for low-cost homeownership? | Percentage of completions |
|---|---|---|---|
Clarion | 2,101 | 883 | 42% |
Sovereign | 1,773 | 677 | 38% |
Orbit | 1,520 | 594 | 39% |
Notting Hill Genesis | 1,846 | 547 | 30% |
Metropolitan Thames Valley | 1,236 | 507 | 41% |
L&Q | 2,433 | 488 | 20% |
Platform | 1,448 | 487 | 34% |
Aster | 1,067 | 431 | 40% |
Places for People | 2,680 | 425 | 16% |
Vivid | 1,372 | 408 | 30% |
The argument that this will derail construction is not one that everyone in the sector accepts. Ms Fletcher-Smith says: “I think that’s lazy thinking. Years ago, people said the health and safety regulations were going to cost us a fortune. Rubbish. Just get on with it.”
And she is not alone – plenty of people argue that once standards are set, housing providers will find a way.
The question for the sector, though, is whether the numbers in the pipeline today will paint an accurate picture. Will the sector also “find a way” through the gathering clouds of Brexit, the pandemic and a challenging housing market? Will this be the pinnacle of associations’ building plans, or are we still heading to a future where they are operating as major national house builders? Inside Housing will continue to report on these development plans as the year goes on, to try to find out.
Top 10 associations building the most social rent homes
| Housing association | Total homes of any tenure completed 2019/20 | Of these, how many were for social rent? | Percentage of completions |
|---|---|---|---|
Wheatley | 802 | 601 | 75% |
Platform | 1,448 | 523 | 36% |
Peabody | 1,048 | 388 | 37% |
Places for People | 2,680 | 345 | 13% |
Bromford | 1,027 | 320 | 31% |
LiveWest | 1,245 | 289 | 23% |
Sovereign | 1,773 | 245 | 14% |
United Welsh | 277 | 230 | 83% |
Notting Hill Genesis | 1,846 | 207 | 11% |
Sanctuary | 816 | 205 | 25% |
Tenures are changing
There is no longer one single predominant tenure that housing associations are building. Our top 50 Biggest Builders by completions built almost as many low-cost homeownership homes as they did affordable rent homes (see pie chart, below).
Completions of social rent homes rose 20% year-on-year, from 4,772 to 5,727 in 2019/20, although this is still much lower than in previous years (in 2012, 66% of homes built were for social rent, and market sale completions made up only 4%).
The UK government recommenced funding for social rent in 2017, with an initial £2bn announcement, and £1bn for London. It may be that this surge is the result of that funding coming through.
It was unsurprisingly Wheatley Group in Scotland that built the most social rent homes, as this is the primary tenure subsidised by Holyrood.
However, many English associations are now building in significant numbers.
This can be seen in the top 10 associations building the most homes in this tenure.
On the other hand, there has been a shift towards sale tenures – which, given the wobbly state of the housing market, should give some pause. A total of 90% of Swan’s completions were for a sale tenure (the association says that its pipeline is 60% private and 40% affordable).
Market sale made up 71% of Hyde’s completions last year. Guy Slocombe, chief investment officer at the landlord, says this figure is not representative of the whole programme, which has a target of being 60% affordable tenures, and was distorted by a large number of completions in a joint venture with Countryside and Barratt Homes.
Top 10 associations building the most market sale homes
| Housing association | Total homes of any tenure completed 2019/20 | Of these, how many were for market sale? | Percentage of completions |
|---|---|---|---|
L&Q | 2,433 | 1,068 | 44% |
Places for People | 2,680 | 887 | 33% |
Hyde | 687 | 488 | 71% |
Notting Hill Genesis | 1,846 | 459 | 25% |
Metropolitan Thames Valley | 1,236 | 455 | 37% |
Swan | 708 | 376 | 53% |
Vivid | 1,372 | 355 | 26% |
Home Group | 1,167 | 341 | 29% |
Clarion | 2,101 | 291 | 14% |
Orbit | 1,520 | 287 | 19% |
Risers and fallers
Link Group is this year’s highest new entrant, coming into the pipeline table at fourth.
The Scottish association was expecting to leapfrog Wheatley to become the biggest builder in Scotland, increasing its completions from 131 last year to 1,654 homes this year, driven by long-term projects set in motion as a result of the Scottish government’s ambitious targets and grant.
But, as development manager Hazel Robertson says, that number should not be counted on.
“It’s impossible to know at the moment what the final outcome will be as there may be further restrictions down the line and impacts on the availability of materials and resources.
“2018/19 and 2019/20 saw a huge increase in the number of properties under construction and as many of these are on large sites, they are taking 18 to 24 months to complete and the peak of our building programme is happening now, which would have delivered 1,654 properties this year potentially if COVID had not struck,” she says.
There was overall a lot of upheaval in both tables, even before the pandemic. The Guinness Partnership has notably fallen out of the completions table, building 199 homes in 2019/20, compared with the 1,000 homes it was expecting.
Guinness did not respond to a request for comment by the time this article was published.
Anchor Hanover, which was expecting to build 541 homes, completed 22. Its development director Mark Curran says this was caused by a pause and a realignment in its development strategy caused by the merger of Anchor and Hanover at the end of 2018. The association expects to complete 2,000 homes within five years.
Top 10 associations building the most for-sale homes (any tenure)
Housing association | Percentage of completions that were for sale | Low-cost homeownership | Market sale | All sale tenures | Total completions 2019/20 |
L&Q | 64% | 488 | 1,068 | 1,556 | 2,433 |
Places for People | 49% | 425 | 887 | 1,312 | 2,680 |
Clarion | 56% | 883 | 291 | 1,174 | 2,101 |
Notting Hill Genesis | 54% | 547 | 459 | 1,006 | 1,846 |
Metropolitan Thames Valley | 78% | 507 | 455 | 962 | 1,236 |
Orbit | 58% | 594 | 287 | 881 | 1,520 |
Vivid | 56% | 408 | 355 | 763 | 1,372 |
Sovereign | 42% | 677 | 71 | 748 | 1,773 |
Swan | 90% | 260 | 376 | 636 | 708 |
Peabody Trust | 59% | 400 | 214 | 614 | 1,048 |
Methodology
The Biggest Builders index is compiled by sending a detailed survey to the 100 biggest housing associations in
the UK.
From that, we chose the top 50 Biggest Builders by completions – the ones who completed the most homes between April 2019 and March 2020.
We also have a top 50 Biggest Builders by pipeline – those who expect to build the most in the current financial year, or between April 2020 and March 2021.
We ask about the tenure of homes being built and how they are financed.
Correction
UPDATE 9.9.2020 9.31am
Midland Heart's data has been corrected. Due to an error in the data reported to us, we originally recorded that Midland Heart built 305 social rent homes and 41 affordable rent homes. These numbers got switched around -in fact Midland Heart built 41 social rent home, and 305 at affordable rent.
As a result of this error, we also wrongly reported that 54% of Midland Heart's completions were social rent. In fact this figure is 7%.


