You are viewing 1 of your 1 free articles
The cost of homelessness: council spend on temporary accommodation revealed
New research has revealed how much councils are spending on temporary accommodation across England. Nathaniel Barker analyses the financial impact. Picture by Alamy

Exclusive Inside Housing research has revealed that English councils spent £937m on temporary accommodation for homeless households in the past financial year alone.
That’s a lot of money. But it’s far from the only eye-opening figure revealed by data obtained from 290 local authorities through the Freedom of Information Act (FOIA). Here, we analyse the financial impact of the crisis on town halls.
Between 2013/14 and 2017/18, English town halls coughed up a total of £3.87bn for temporary accommodation. Over that period, the annual bill rocketed by 56% – up from £602m five years ago. If that trend continues, the spend for 2018/19 could well run into 10 figures.
READ MORE


In fact, given that 36 councils had not responded to our information requests by the time this story went to press – including the major metropolitan areas of Bristol, Leeds and Leicester – the actual figure for the past year could already be close to the £1bn mark.
The numbers quoted above represent the gross spend; that is the total initial spend not including money clawed back in rental income – almost all of which will be paid through housing benefit. Analysis of data from the 54 authorities which provided both gross and net figures shows they only bore 21.4% of the costs themselves over the past five years.
In other words, the government paid out an estimated £3bn in housing benefit to keep people in temporary accommodation in the 290 councils that responded to our request for information.
Behind these figures are thousands of people and their families. Some of them will be highly vulnerable, some will have disabilities, while others will be working people – nurses, cleaners and teaching assistants – unable to afford rising housing costs. Often they will be moved many miles away from their jobs, children’s schools and support networks or living out of bags in cramped, inadequate conditions as councils attempt to limit the massive cost of giving them shelter.
Temporary accommodation spending in the last five years by local authority
| Council | 2017/18 | 2016/17 | 2015/16 | 2014/15 | 2013/14 | Notes |
|---|---|---|---|---|---|---|
| Adur | £874,660.00 | £708,133.00 | £616,050.00 | £625,301.00 | £683,066.00 | |
| Allerdale | £47,324.00 | £55,259.00 | £53,192.00 | £58,617.00 | £57,278.00 | |
| Amber Valley | £11,665.90 | £1,896.00 | £3,906.00 | £2,140.00 | £3,945.00 | |
| Arun | £776,648.98 | £457,579.16 | £314,321.98 | £366,726.31 | £408,110.48 | |
| Ashfield | £43,232.89 | £52,907.41 | £122,765.33 | £231,410.57 | £164,364.86 | |
| Babergh | £155,059.00 | £150,474.00 | £212,953.00 | £149,031.00 | £103,647.00 | |
| Barking and Dagenham | £21,665,000.00 | £19,816,000.00 | £17,875,000.00 | £16,570,000.00 | £15,643,000.00 | |
| Barnet | £24,329,556.88 | £24,818,229.29 | £20,912,991.00 | £16,207,163.00 | £13,346,853.00 | |
| Barnsley | £40,316.58 | £30,323.59 | £39,987.77 | £76,028.90 | £60,395.18 | |
| Barrow-in-Furness | £152,227.98 | £162,102.77 | £178,175.26 | £149,664.74 | £152,365.14 | |
| Basildon | £26,106.00 | £7,364.00 | £131,963.00 | £1,251,583.00 | £290,037.00 | |
| Basingstoke and Deane | £34,589.00 | £50,241.92 | £45,295.26 | £114,406.48 | £78,872.61 | |
| Bassetlaw | £36,504.10 | £38,423.76 | £14,458.42 | £30,123.60 | £8,491.13 | |
| Bath and North East Somerset | £217,350.00 | £217,350.00 | £217,350.00 | £217,350.00 | Now commissioned by Virgin Care | |
| Bedford | £1,352,549.00 | £967,777.00 | £715,647.00 | £656,637.00 | £634,291.00 | |
| Bexley | £10,363,558.30 | £8,112,526.18 | £6,039,462.96 | £4,807,068.56 | £3,300,567.72 | |
| Birmingham | £22,978,867.00 | £17,226,520.00 | £10,511,777.00 | £9,715,817.00 | £8,831,337.00 | |
| Blaby | £24,404.09 | £10,772.96 | £18,642.30 | £3,853.00 | £5,787.45 | |
| Blackburn with Darwen | £59,818.00 | £60,704.00 | £55,321.50 | £52,758.82 | £59,073.17 | |
| Blackpool | £408,009.00 | £398,099.00 | £360,415.00 | £313,765.00 | £312,882.00 | |
| Bolsover | £8,509.00 | £10,384.00 | £14,619.00 | £10,281.00 | £12,330.00 | |
| Boston | £13,826.00 | £23,176.00 | £27,964.00 | £27,391.00 | £30,018.00 | |
| Bournemouth | £197,889.00 | £133,047.00 | £32,968.00 | £271,209.00 | £115,831.00 | |
| Bracknell Forest | £777,999.00 | £718,087.00 | £923,962.00 | £531,032.00 | £112,368.00 | |
| Bradford | £974,417.47 | £803,107.00 | £625,150.00 | £715,910.00 | £859,603.00 | |
| Braintree | £75,453.44 | £43,030.50 | £33,396.04 | £33,097.85 | £35,951.05 | |
| Brent | £37,916,000.00 | £35,774,000.00 | £22,174,000.00 | £23,990,000.00 | £18,927,000.00 | |
| Brighton and Hove | £16,531,066.00 | £14,074,713.00 | £12,817,416.00 | £11,435,616.00 | £10,666,457.00 | |
| Broadland | £424,453.00 | £521,318.00 | £526,159.00 | £445,328.00 | £388,300.00 | |
| Bromley | £15,922,834.00 | £14,510,836.00 | £12,591,934.00 | £9,030,441.00 | £7,044,048.00 | |
| Bromsgrove | £27,734.45 | £11,042.47 | £13,923.92 | £19,019.81 | £13,880.53 | |
| Broxbourne | £868,983.84 | £522,372.09 | £192,683.06 | £160,363.31 | £270,389.39 | |
| Broxtowe | £38,376.00 | £20,798.00 | £10,850.00 | £15,946.00 | £22,621.00 | |
| Burnley | £40,442.00 | £17,526.00 | £19,048.00 | £21,613.00 | £49,543.00 | |
| Calderdale | £510,801.04 | £599,920.72 | £488,686.24 | £504,820.98 | £547,851.21 | |
| Cambridge | £441,794.85 | £618,861.71 | £884,756.13 | £767,220.43 | £875,218.36 | |
| Camden | £14,299,348.36 | £14,521,190.74 | £14,917,721.64 | £16,789,863.17 | £17,795,987.49 | |
| Cannock Chase | £40,983.00 | £19,844.00 | £22,415.00 | £39,086.00 | £46,445.00 | |
| Canterbury | £482,932.20 | £311,989.29 | £383,002.92 | £134,877.32 | £87,461.56 | |
| Carlisle | £45,520.00 | £0.00 | £0.00 | £0.00 | £113,804.00 | |
| Central Bedfordshire | £2,075,680.00 | £935,444.00 | £1,070,780.00 | £225,551.00 | £74,644.00 | |
| Charnwood | £201,990.64 | £130,599.10 | £36,637.81 | £56,895.47 | £88,913.59 | |
| Chelmsford | £4,233,000.00 | £3,473,000.00 | £2,373,000.00 | £1,634,000.00 | £1,514,000.00 | |
| Cheltenham | £37,347.00 | £34,742.00 | £57,173.00 | £25,932.00 | £3,423.00 | Data only provided for last quarter of 2013/14 |
| Cherwell | £80,488.67 | £27,883.97 | £55,826.77 | £52,774.56 | £49,003.26 | |
| Cheshire East | £130,920.65 | £153,084.84 | £186,326.89 | £194,540.25 | £113,654.80 | |
| Cheshire West and Chester | £396,376.00 | £266,952.00 | £417,319.00 | £366,042.00 | £244,579.00 | |
| Chesterfield | £32,525.24 | £32,422.80 | £80,352.88 | £70,654.17 | £65,563.95 | |
| Chichester | £120,634.31 | £73,167.97 | £125,084.76 | £50,237.00 | £49,982.36 | |
| Chiltern | £230,000.00 | £173,000.00 | £108,000.00 | £60,857.00 | £7,823.00 | |
| Chorley | £354,848.00 | £285,760.00 | £304,353.00 | £307,837.00 | £320,841.00 | |
| Christchurch | £25,231.19 | £24,432.00 | £21,500.77 | £117,671.79 | £108,760.33 | |
| City of London | £280,958.00 | £311,630.00 | £304,737.00 | £121,607.00 | £190,703.00 | |
| Colchester | £397,174.00 | £914,502.00 | £546,042.00 | £307,017.00 | £418,856.00 | |
| Copeland | £54,537.00 | £55,844.00 | £62,736.00 | £58,878.00 | £57,910.00 | |
| Corby | £278,427.67 | £101,511.76 | £78,989.28 | £74,027.56 | £104,100.16 | |
| Cornwall | £2,784,506.00 | £2,026,425.00 | £2,350,325.00 | £2,758,313.00 | £2,988,298.00 | |
| Cotswold | £9,927.74 | £63,370.72 | £18,755.20 | £23,927.60 | £27,108.22 | |
| County Durham | £76,825.00 | £10,343.00 | £16,011.00 | £6,581.00 | £19,036.00 | |
| Coventry | £4,103,000.00 | £2,896,000.00 | £1,365,000.00 | £808,000.00 | £573,000.00 | |
| Craven | £90,487.31 | £109,826.00 | £127,300.00 | £72,675.00 | £99,946.00 | |
| Crawley | £613,442.20 | £1,321,235.70 | £1,268,230.10 | £1,284,887.02 | £1,404,396.97 | |
| Croydon | £32,852,248.00 | £26,833,337.00 | £20,504,639.00 | £17,691,805.00 | £13,909,313.00 | |
| Dacorum | £514,595.58 | £521,308.53 | £554,669.10 | £485,771.73 | £519,612.57 | |
| Darlington | £113,725.00 | £139,072.00 | £131,759.00 | £151,203.00 | £148,664.00 | |
| Dartford | £2,927,059.91 | £2,360,522.60 | £1,655,639.04 | £1,195,446.33 | £936,853.98 | |
| Daventry | £168,637.00 | £82,667.00 | £67,026.00 | £27,535.00 | £34,173.00 | |
| Derbyshire Dales | £12,408.00 | £16,750.84 | £13,851.16 | £6,157.79 | £4,234.75 | |
| Doncaster | £229,824.87 | £112,445.38 | £48,299.72 | £186,641.84 | Data for 2013/14 not provided | |
| Dover | £965,371.00 | £460,672.00 | £235,034.00 | £208,677.00 | £143,317.00 | |
| Dudley | £40,642.89 | £18,498.42 | £39,264.35 | £63,903.19 | £40,428.88 | |
| Ealing | £37,173,488.00 | £39,634,439.00 | £40,448,624.00 | £37,759,310.00 | £31,225,393.00 | |
| East Cambridgeshire | £0.00 | £0.00 | £0.00 | £8,819.71 | £123,201.06 | |
| East Devon | £219,024.13 | £77,115.35 | £19,401.09 | £19,621.02 | £55,749.58 | |
| East Dorset | £48,970.67 | £32,719.35 | £22,748.04 | £17,151.75 | £55,888.21 | |
| East Hampshire | £53,570.00 | £67,847.00 | £42,991.00 | £78,352.00 | £19,396.00 | |
| East Hertfordshire | £212,831.56 | £222,663.70 | £220,956.00 | £246,072.00 | £214,549.00 | |
| East Northamptonshire | £22,398.00 | £15,254.00 | £6,199.00 | £11,678.00 | £22,923.00 | |
| East Riding of Yorkshire | £72,349.90 | £312,723.29 | £267,379.00 | £338,425.03 | £231,885.52 | |
| East Staffordshire | £244,975.01 | £180,126.64 | £134,676.87 | £118,819.97 | £54,617.21 | |
| Eastbourne | £1,256,328.36 | £898,051.89 | £377,236.29 | £250,629.86 | £171,969.17 | |
| Eastleigh | £72,469.00 | £95,606.00 | £149,607.00 | £216,993.00 | £190,813.00 | |
| Eden | £19,354.10 | £12,365.20 | £8,988.81 | £14,854.45 | £25,008.24 | |
| Elmbridge | £240,808.00 | £224,945.00 | £139,053.00 | £47,892.00 | £155,575.00 | |
| Enfield | £49,898,406.00 | £43,653,477.00 | £39,447,514.00 | £32,443,071.00 | £26,464,592.00 | |
| Epping Forest | £725,306.00 | £528,611.00 | £610,560.00 | £571,801.00 | £523,497.00 | |
| Erewash | £79,608.00 | £78,176.47 | £79,238.77 | £86,867.75 | £68,643.12 | |
| Exeter | £218,435.00 | £122,808.00 | £104,535.00 | £430,474.00 | £288,878.00 | |
| Fareham | £1,011,485.42 | £953,776.96 | £853,349.52 | £709,959.20 | £827,496.36 | |
| Fenland | £19,869.61 | £41,469.29 | £24,069.60 | £33,730.60 | £20,217.98 | |
| Folkestone and Hythe | £1,118,435.04 | £552,512.81 | £588,467.54 | £373,029.94 | £271,225.68 | |
| Forest Heath | £86,539.00 | £13,086.00 | £7,896.00 | £49,180.00 | £15,281.00 | |
| Forest of Dean | £6,953.08 | £26,135.02 | £28,482.12 | £24,761.78 | £11,342.84 | |
| Fylde | £36,589.00 | £42,127.00 | £39,708.00 | £21,805.00 | £47,087.00 | |
| Gateshead | £116,942.00 | £107,752.00 | £61,998.00 | £76,379.00 | £151,544.00 | |
| Gedling | £99,414.66 | £49,546.72 | £60,887.24 | £49,756.93 | £44,557.92 | |
| Gloucester | £712,985.00 | £538,032.00 | £169,018.00 | £185,570.00 | £179,283.00 | |
| Gravesham | £69,469.00 | £9,840.00 | £13,010.00 | £114,820.00 | £32,080.00 | |
| Great Yarmouth | £139,242.53 | £125,338.11 | £660,871.84 | £1,100,051.74 | £1,175,802.34 | |
| Greenwich | £7,154,470.00 | £6,458,114.00 | £5,659,620.00 | £4,506,916.00 | £3,190,510.00 | |
| Guildford | £82,615.00 | £35,181.00 | £33,737.00 | £51,219.00 | £63,410.00 | |
| Hackney | £54,774,812.00 | £41,731,301.00 | £35,198,856.00 | £26,342,844.00 | £25,593,750.00 | |
| Halton | £948,530.00 | £948,530.00 | £948,530.00 | £1,191,717.00 | £1,289,056.00 | |
| Hambleton | £45,267.02 | £59,179.99 | £42,594.34 | £35,483.47 | £67,323.59 | |
| Hammersmith and Fulham | £1,622,396.00 | £3,332,026.00 | £1,998,037.00 | £1,254,730.00 | £953,512.00 | |
| Harborough | £65,896.00 | £30,480.00 | £31,000.00 | £4,790.00 | £10,264.00 | |
| Haringey | £38,889,000.00 | £38,262,000.00 | £38,121,000.00 | £32,730,000.00 | £28,324,000.00 | |
| Harlow | £2,860,894.00 | £4,183,149.00 | £4,031,055.00 | £2,839,693.00 | £1,207,935.00 | |
| Harrogate | £266,674.15 | £280,859.62 | £288,845.09 | £236,944.27 | £296,713.09 | |
| Harrow | £2,860,894.00 | £4,183,149.00 | £4,031,055.00 | £2,839,693.00 | £1,207,935.00 | |
| Hart | £24,599.56 | £13,978.70 | £13,391.72 | £11,753.32 | £4,616.17 | |
| Hartlepool | £40,050.00 | £31,107.00 | £18,823.00 | £29,066.00 | £19,781.00 | |
| Hastings | £920,347.00 | £541,450.53 | £315,343.37 | £326,601.88 | £240,051.79 | |
| Havant | £144,766.74 | £130,316.34 | £190,754.87 | £109,926.80 | £60,904.33 | |
| Havering | £13,943,180.37 | £12,882,557.80 | £10,173,039.70 | £9,549,984.00 | £8,868,880.00 | |
| Herefordshire, County of | £331,612.00 | £231,997.00 | £200,445.00 | £257,618.00 | £348,315.00 | |
| Hertsmere | £1,539,607.00 | £1,222,824.00 | £1,155,428.00 | £950,301.00 | £751,054.00 | |
| High Peak | £9,488.11 | £6,871.05 | £3,091.15 | £4,373.53 | £6,257.34 | |
| Hillingdon | £5,376,284.83 | £6,167,869.55 | £5,963,004.38 | £5,943,805.29 | £7,304,346.41 | |
| Hinckley and Bosworth | £75,201.00 | £29,961.72 | £21,420.39 | £35,315.51 | £37,023.85 | |
| Horsham | £263,047.00 | £277,345.00 | £157,493.90 | £273,769.30 | £322,849.00 | |
| Hounslow | £8,053,255.83 | £11,236,190.65 | £14,312,373.74 | £14,191,432.40 | £13,171,032.49 | |
| Huntingdonshire | £940,739.00 | £659,641.00 | £334,919.00 | £438,659.00 | £434,098.00 | |
| Ipswich | £760,897.00 | £795,095.00 | £633,592.00 | £556,884.00 | £406,862.00 | |
| Islington | £9,221,181.89 | £10,339,750.77 | £11,045,545.59 | £11,673,573.79 | £11,362,436.10 | |
| Kensington and Chelsea | £33,643,101.00 | £30,743,532.00 | £27,500,428.00 | £25,130,429.00 | £21,900,504.00 | |
| Kettering | £1,134,146.00 | £498,055.00 | £196,600.00 | £191,455.00 | £224,003.00 | |
| King's Lynn and West Norfolk | £16,731.00 | £41,032.85 | £13,397.50 | £19,416.43 | £8,090.79 | |
| Kingston upon Hull, City of | £98,147.60 | £105,730.00 | £123,860.00 | £101,666.62 | £105,211.98 | |
| Kingston upon Thames | £7,838,499.00 | £8,267,672.00 | £6,452,073.00 | £5,805,790.00 | £5,714,246.00 | |
| Kirklees | £1,483,919.00 | £1,602,987.00 | £1,588,548.00 | £1,322,300.00 | £1,926,399.00 | |
| Knowsley | £111,129.00 | £88,641.00 | £107,038.00 | £59,480.00 | £118,033.00 | |
| Lambeth | £30,158,362.43 | £29,722,371.17 | £29,835,425.78 | £25,870,429.56 | £17,891,109.35 | |
| Lancaster | £21,541.00 | £24,868.00 | £25,750.00 | £46,201.00 | £44,312.00 | |
| Lewes | £647,629.00 | £541,366.00 | £901,891.00 | £837,729.00 | £872,709.00 | |
| Lewisham | £24,751,651.00 | £22,752,258.00 | £25,778,399.00 | £22,888,060.00 | £14,833,177.00 | |
| Lichfield | £14,258.95 | £20,293.90 | £12,364.84 | £12,947.89 | £5,174.41 | |
| Lincoln | £183,480.00 | £125,478.00 | £148,790.00 | £245,919.00 | £164,030.00 | |
| Liverpool | £7,016,500.00 | £7,609,730.00 | £9,124,003.00 | £9,772,495.00 | £9,827,656.00 | |
| Luton | £14,369,605.00 | £14,662,783.00 | £11,125,176.00 | £9,205,210.00 | £8,174,603.00 | |
| Maidstone | £1,160,924.00 | £1,542,401.00 | £1,188,421.00 | £856,584.00 | £623,069.00 | |
| Maldon | £34,636.83 | £14,092.38 | £13,701.00 | £19,575.66 | £6,609.09 | |
| Manchester | £20,419,679.00 | £14,862,171.00 | £11,117,513.00 | £11,561,147.00 | £11,740,326.00 | |
| Mansfield | £406,241.00 | £320,305.00 | £367,749.00 | £373,863.00 | £358,172.00 | |
| Melton | £38,698.59 | £65,697.03 | £112,153.87 | £102,315.35 | £56,421.00 | |
| Mendip | £14,623.13 | £36,605.61 | £88,604.51 | £106,874.21 | £62,862.68 | |
| Merton | £3,097,078.00 | £3,553,142.00 | £2,277,513.00 | £2,011,293.00 | £1,409,219.00 | |
| Mid Devon | £122,310.00 | £101,245.00 | £38,293.00 | £49,362.00 | £45,212.00 | |
| Mid Suffolk | £119,640.00 | £59,010.00 | £80,484.00 | £94,435.00 | £94,046.00 | |
| Mid Sussex | £346,346.00 | £254,070.00 | £131,619.00 | £66,646.00 | £105,141.00 | |
| Middlesbrough | £151,816.62 | £98,396.00 | £26,601.00 | £27,671.00 | £58,683.00 | |
| Milton Keynes | £5,161,265.00 | £4,168,819.00 | £2,378,087.00 | £979,884.00 | £1,025,512.00 | |
| Mole Valley | £111,362.00 | £126,951.00 | £67,231.00 | £52,398.00 | £32,296.00 | |
| New Forest | £1,702,902.18 | £1,303,204.20 | £1,439,875.14 | £1,333,198.00 | £1,014,099.00 | |
| Newark and Sherwood | £35,773.24 | £46,162.94 | £54,967.49 | £44,905.06 | £38,838.99 | |
| Newcastle upon Tyne | £633,895.00 | £600,685.00 | £681,339.00 | £610,945.00 | £657,560.00 | |
| Newcastle-under-Lyme | £53,222.31 | £51,142.21 | £45,179.76 | £31,475.59 | £30,699.60 | |
| Newham | £61,100,000.00 | £61,069,621.09 | £49,522,828.19 | £39,528,925.55 | £35,112,107.65 | 2017/18 is estimate as figure not provided |
| North Devon | £252,000.00 | £252,348.07 | £207,252.34 | £252,111.49 | £345,553.49 | 2017/18 is estimate as figure not provided |
| North East Derbyshire | £13,049.40 | £28,187.00 | £24,894.04 | £21,404.00 | £17,626.59 | |
| North East Lincolnshire | £320,844.00 | £303,578.00 | £218,401.00 | £195,603.00 | £157,133.00 | |
| North Hertfordshire | £33,740.72 | £75,712.62 | £284,230.34 | £141,297.45 | Data for 2013/14 not provided | |
| North Kesteven | £44,087.50 | £46,657.10 | £37,420.97 | £29,878.17 | £22,369.00 | |
| North Lincolnshire | £97,038.22 | £43,074.45 | £32,754.00 | £45,137.44 | £46,584.00 | |
| North Norfolk | £182,952.36 | £97,842.95 | £78,292.04 | £50,312.51 | £60,591.94 | |
| North Somerset | £54,929.00 | £18,166.00 | £10,393.00 | £28,045.00 | £75,500.00 | |
| North Tyneside | £222,104.49 | £235,438.77 | £248,057.86 | £283,190.61 | £327,625.19 | |
| North Warwickshire | £187,712.00 | £104,258.00 | £102,366.00 | £143,326.00 | £187,556.00 | |
| North West Leicestershire | £19,160.14 | £8,087.05 | £19,505.26 | £27,439.33 | £36,509.44 | |
| Northampton | £2,643,192.00 | £1,338,922.00 | £547,618.00 | £367,112.00 | £278,860.00 | |
| Northumberland | £197,407.00 | £210,974.00 | £252,203.00 | £249,835.00 | £241,250.00 | |
| Norwich | £193,735.00 | £290,171.00 | £178,900.00 | £146,109.00 | £145,288.00 | |
| Nottingham | £3,994,337.22 | £3,751,619.00 | £3,274,021.00 | £3,183,923.00 | £3,534,818.00 | |
| Nuneaton and Bedworth | £302,594.16 | £303,948.79 | £291,277.32 | £243,714.70 | ||
| Oadby and Wigston | £91,973.93 | £74,551.99 | £53,840.21 | £49,115.27 | £56,885.93 | |
| Oldham | £190,062.00 | £390,795.00 | £225,901.00 | £251,650.00 | £273,206.00 | Data only provided for first two quarters of 2017/18 |
| Oxford | £2,081,000.00 | £2,140,000.00 | £2,108,000.00 | £2,150,000.00 | £2,082,000.00 | Taken from official local authority expenditure stats on advice from council |
| Peterborough | £3,734,916.43 | £2,223,139.25 | £280,384.12 | £164,287.99 | £235,433.48 | |
| Plymouth | £1,132,788.00 | £675,234.00 | £473,777.00 | £329,130.00 | £46,245.00 | |
| Poole | £1,351,032.00 | £1,025,979.00 | £744,821.00 | £518,651.00 | £713,567.00 | |
| Portsmouth | £1,006,000.00 | £779,000.00 | £793,000.00 | £741,000.00 | £727,000.00 | |
| Preston | £88,696.00 | £63,773.46 | £54,448.00 | £54,465.00 | £53,984.00 | |
| Purbeck | £235,958.12 | £117,455.00 | £153,374.00 | £89,871.00 | £47,693.00 | |
| Reading | £1,000,000.00 | £1,587,818.00 | £1,547,010.00 | £1,316,579.00 | £569,239.00 | 2017/18 is estimate as figure not provided |
| Redbridge | £34,343,000.00 | £34,075,000.00 | £30,374,000.00 | £28,010,000.00 | £25,662,000.00 | |
| Redcar and Cleveland | £47,434.00 | £31,700.00 | £48,000.00 | £33,300.00 | £67,000.00 | |
| Reigate and Banstead | £117,000.00 | £234,000.00 | £563,000.00 | £461,000.00 | £204,000.00 | |
| Ribble Valley | £24,887.00 | £24,120.00 | £14,528.00 | £12,680.00 | £15,908.00 | |
| Richmond upon Thames | £4,841,000.00 | £4,663,000.00 | £4,318,000.00 | £4,390,000.00 | £4,561,000.00 | |
| Richmondshire | £176,459.69 | £131,840.21 | £121,979.85 | £52,925.04 | £83,839.73 | |
| Rochdale | £43,567.80 | £60,356.37 | £32,025.68 | £329,549.00 | 2015/16 figure not held by authority | |
| Rochford | £1,057,983.00 | £854,780.00 | £636,962.00 | £585,923.00 | £613,142.00 | |
| Rossendale | £31,135.00 | £11,460.00 | £20,565.00 | £12,236.16 | £3,639.83 | |
| Rother | £670,292.32 | £426,582.27 | £270,771.22 | £211,179.50 | £194,343.81 | |
| Rotherham | £119,944.02 | £83,266.59 | £77,701.67 | £75,623.15 | £110,883.33 | |
| Rugby | £709,420.00 | £560,660.00 | £384,151.00 | £205,343.00 | £98,610.00 | |
| Runnymede | £353,791.00 | £251,571.00 | £276,546.00 | £237,605.00 | £64,810.00 | |
| Rushcliffe | £143,152.00 | £142,970.00 | £160,906.00 | £133,612.00 | £174,661.00 | |
| Rushmoor | £93,157.01 | £68,726.09 | £137,115.47 | £172,592.61 | £250,815.91 | |
| Rutland | £20,000.00 | £13,000.00 | £18,000.00 | £15,000.00 | £20,000.00 | |
| Ryedale | £4,274.17 | £911.93 | £1,402.43 | £391.45 | £1,452.90 | |
| Sandwell | £729,648.78 | £412,546.40 | £443,834.45 | £397,660.41 | £232,158.42 | |
| Scarborough | £170,000.00 | £112,000.00 | £98,000.00 | £156,000.00 | £165,000.00 | |
| Sedgemoor | £79,043.00 | £70,512.00 | £85,326.00 | £94,449.00 | £67,663.00 | |
| Sefton | £144,788.47 | £203,594.38 | £159,449.65 | £177,835.67 | £172,293.79 | |
| Sevenoaks | £77,046.00 | £44,538.00 | £33,173.00 | £31,239.00 | £5,651.00 | |
| Sheffield | £72,033.00 | £35,836.00 | £21,235.00 | £39,024.00 | £177,441.00 | |
| Shropshire | £1,398,496.00 | £1,086,475.00 | £700,802.00 | £582,093.00 | £458,323.00 | |
| Slough | £3,137,672.00 | £2,996,415.00 | £2,316,124.00 | £839,543.00 | £643,008.00 | |
| Solihull | £44,202.70 | -£20,508.57 | £109,682.90 | £279,585.07 | £91,742.25 | Appear to be net figures: quering with authority |
| South Bucks | £944,000.00 | £920,000.00 | £464,000.00 | £176,091.00 | £166,025.00 | |
| South Cambridgeshire | £89,344.49 | £67,470.00 | £85,448.83 | £96,292.48 | £112,424.66 | |
| South Derbyshire | £141,585.76 | £66,884.87 | £57,399.90 | £111,772.41 | £91,866.41 | |
| South Gloucestershire | £1,148,000.00 | £1,107,000.00 | £868,000.00 | £1,118,000.00 | £910,000.00 | |
| South Hams | £130,353.68 | £70,668.98 | £78,529.31 | £129,099.21 | £203,778.10 | |
| South Holland | £39,141.94 | £7,272.32 | £15,123.75 | £1,973.65 | £3,456.99 | |
| South Kesteven | £45,437.00 | £25,104.00 | £7,079.00 | £53,053.00 | £44,961.00 | |
| South Lakeland | £210,288.31 | £95,655.45 | £36,915.85 | £19,824.69 | £40,061.98 | |
| South Norfolk | £67,614.66 | £129,591.97 | £102,174.16 | £107,946.73 | £88,973.42 | Data for last two months of 2017/18 not provided |
| South Northamptonshire | £80,488.67 | £27,883.97 | £55,826.77 | £52,774.56 | £49,003.26 | |
| South Oxfordshire | £22,272.00 | £58,978.00 | £61,860.00 | £66,727.00 | £106,228.00 | |
| South Ribble | £36,787.00 | £36,614.00 | £34,823.00 | £37,771.00 | £43,042.00 | |
| South Somerset | £7,617.00 | £14,544.00 | £11,112.00 | £8,588.00 | £22,567.00 | |
| Southampton | £92,544.00 | £89,739.00 | £56,942.00 | £72,607.00 | £69,238.00 | |
| Southend-on-Sea | £513,997.67 | £436,796.93 | £395,198.72 | £372,571.91 | £379,412.77 | |
| Southwark | £21,939,530.64 | £18,654,567.16 | £16,062,553.41 | £14,572,134.22 | £11,322,347.22 | |
| Spelthorne | £1,449,347.69 | £1,317,028.38 | £1,609,645.37 | £1,056,224.41 | £575,972.04 | |
| St Albans | £59,744.92 | £35,031.63 | £56,300.02 | £123,493.64 | £33,339.50 | |
| St Edmundsbury | £189,186.00 | £156,942.00 | £90,271.00 | £159,452.00 | £287,085.00 | |
| St. Helens | £8,461.67 | £13,921.07 | £41,422.04 | £6,339.29 | £1,663.96 | |
| Stafford | £72,472.39 | £47,565.62 | £66,834.95 | £24,969.08 | £46,317.02 | |
| Stevenage | £1,189,307.00 | £1,130,213.00 | £998,551.00 | £955,459.00 | £965,097.00 | |
| Stockport | £1,210,699.00 | £1,210,699.00 | £907,522.00 | £1,453,234.00 | £1,210,699.00 | |
| Stockton-on-Tees | £38,123.00 | £9,432.00 | £43,131.00 | £116,850.00 | £150,215.00 | |
| Stoke-on-Trent | £287,956.00 | £283,684.00 | £203,312.00 | £141,409.00 | £258,282.00 | |
| Stroud | £136,456.35 | £77,381.03 | £59,999.69 | £46,641.97 | £59,278.81 | |
| Suffolk Coastal | £92,228.43 | £27,105.02 | £17,758.98 | £25,872.27 | £20,657.09 | |
| Sunderland | £33,890.47 | £33,642.99 | £27,944.13 | £39,552.61 | £76,650.95 | |
| Surrey Heath | £29,170.00 | £57,610.00 | £55,065.00 | £43,702.00 | £109,084.00 | |
| Sutton | £1,058,719.23 | £1,201,114.00 | £649,866.98 | £415,980.83 | £231,565.51 | |
| Swale | £841,454.00 | £559,000.00 | £272,644.00 | £256,417.00 | £256,217.00 | |
| Swindon | £3,667,212.40 | £3,984,697.28 | £3,633,029.04 | £2,958,302.85 | £2,641,356.72 | |
| Tameside | £1,139,336.00 | £803,783.00 | £555,734.00 | £305,380.00 | £314,609.00 | |
| Tamworth | £262,390.71 | £438,545.25 | £273,407.64 | £211,587.77 | £87,927.02 | |
| Tandridge | £500.46 | £2,122.83 | £1,827.84 | £2,644.11 | £56.20 | |
| Teignbridge | £803,011.00 | £1,042,105.00 | £806,609.63 | £624,516.19 | £763,592.47 | |
| Telford and Wrekin | £1,508,582.21 | £946,439.45 | £771,324.72 | £726,772.04 | £913,835.57 | |
| Tendring | £338,980.00 | £303,092.00 | £103,308.00 | £71,382.00 | £22,368.00 | |
| Test Valley | £90,729.00 | £78,570.00 | £45,465.00 | £51,873.00 | £54,002.00 | |
| Thanet | £580,231.00 | £1,103,649.25 | £390,259.05 | £267,035.09 | £137,747.41 | |
| Three Rivers | £469,542.80 | £799,240.63 | £424,470.74 | £108,168.17 | £52,215.57 | |
| Tonbridge and Malling | £424,333.00 | £461,560.00 | £315,131.00 | £265,166.00 | £142,388.00 | |
| Torbay | £635,553.00 | £668,527.00 | £483,530.00 | £421,860.00 | £357,496.00 | |
| Torridge | £272,238.86 | £194,797.43 | £187,199.67 | £215,442.83 | £195,565.79 | |
| Tower Hamlets | £29,811,464.00 | £29,532,278.00 | £29,320,360.00 | £28,514,942.60 | £28,067,648.64 | |
| Trafford | £459,123.00 | £408,073.00 | £379,866.00 | £333,560.00 | £315,626.00 | |
| Tunbridge Wells | £332,472.00 | £260,310.00 | £249,040.00 | £216,893.00 | £259,754.00 | |
| Uttlesford | £39,283.00 | £87,642.00 | £68,531.33 | £41,505.62 | £43,961.15 | |
| Vale of White Horse | £35,544.00 | £20,773.00 | £55,201.00 | £71,883.00 | £140,278.00 | |
| Wakefield | £1,957,388.34 | £1,690,433.47 | £1,658,854.34 | £1,506,777.77 | £1,424,329.25 | |
| Walsall | £787,174.00 | £604,444.00 | £429,965.00 | £445,459.00 | £369,034.00 | |
| Waltham Forest | £30,716,066.82 | £30,344,776.77 | £31,582,673.13 | £27,455,351.00 | £21,490,211.76 | |
| Wandsworth | £15,740,857.51 | £12,548,455.02 | £11,020,839.17 | £9,001,584.13 | £4,622,202.02 | |
| Warrington | £50,416.00 | £106,335.00 | £61,259.00 | £31,995.00 | £41,916.00 | |
| Warwick | £62,948.00 | £151,156.00 | £84,309.00 | £36,638.00 | £75,523.00 | |
| Watford | £365,222.00 | £712,396.00 | £1,028,832.00 | £327,282.00 | £122,169.00 | |
| Waveney | £171,639.53 | £156,912.49 | £122,001.14 | £106,724.09 | £140,215.49 | |
| Waverley | £5,532.30 | £10,527.42 | £20,725.17 | £22,173.91 | £29,189.33 | |
| Wealden | £227,487.22 | £177,602.45 | £191,397.08 | £165,589.36 | £302,690.24 | |
| Welwyn Hatfield | £510,320.00 | £475,780.00 | £510,750.00 | £523,510.00 | £503,200.00 | |
| West Berkshire | £696,625.56 | £369,684.35 | £403,293.39 | £291,797.29 | £284,439.45 | |
| West Devon | £145,701.14 | £143,515.84 | £139,653.47 | £120,649.93 | £277,711.85 | |
| West Dorset | £109,000.00 | £109,126.70 | £89,512.63 | £108,274.30 | £41,797.51 | 2017/18 is estimate as figure not provided |
| West Lancashire | £30,720.00 | £30,720.00 | £36,090.00 | £36,090.00 | £36,090.00 | |
| West Lindsey | £21,287.97 | £9,898.73 | £27,697.47 | £32,505.96 | £41,949.97 | |
| West Oxfordshire | £106,516.09 | £116,006.50 | £68,655.23 | £107,830.88 | £47,332.75 | |
| Westminster | £48,025,000.00 | £46,458,000.00 | £45,610,000.00 | £39,189,000.00 | £42,271,000.00 | |
| Wigan | £335,803.00 | £249,554.00 | £205,629.00 | £248,302.00 | £238,451.00 | |
| Winchester | £319,249.00 | £280,549.00 | £239,690.00 | £238,074.00 | £237,006.00 | |
| Windsor and Maidenhead | £2,027,490.00 | £960,251.00 | £215,126.00 | £172,046.00 | £449,942.00 | |
| Wirral | £99,915.04 | £92,379.97 | £108,454.59 | £90,708.50 | £271,389.94 | |
| Woking | £346,745.00 | £560,815.00 | £470,659.00 | £549,458.00 | £245,388.00 | |
| Wokingham | £512,042.06 | £487,261.47 | £444,483.75 | £205,885.47 | £166,020.86 | |
| Wolverhampton | £969,697.57 | £875,576.00 | £885,657.46 | £800,047.39 | £989,424.19 | |
| Worcester | £448,181.84 | £304,006.79 | £253,323.94 | £285,604.65 | £136,846.28 | |
| Worthing | £1,349,188.00 | £1,070,126.00 | £313,459.00 | £253,473.00 | £232,073.00 | |
| Wychavon | £96,320.88 | £88,559.32 | £92,282.94 | £124,782.65 | £59,457.42 | |
| Wyre | £4,476.80 | £7,363.22 | £9,093.63 | £14,208.89 | £18,127.15 | |
| Wyre Forest | £85,278.78 | £71,784.16 | £38,540.96 | £48,703.13 | £50,819.77 | |
| York | £553,210.00 | £673,209.00 | £544,120.00 | £610,199.00 | £589,293.00 |
Source: Council responses to Inside Housing under the Freedom of Information Act
(FOIA data for Hackney, Camden, Bexley and Bromley councils provided by George Greenwood of the BBC)
According to the last official count, there were 79,880 households in temporary accommodation at the end of March – an increase of 44.8% since 2013. However, housing charity Shelter says that figure downplays the true scale of the crisis and believes close to a quarter of a million households could be in temporary accommodation, according to responses to its own FOIA question from November 2017.
Perhaps unsurprisingly, of our respondents the top 10 biggest spenders are London boroughs. The capital’s 33 authorities accounted for 78.2% of temporary accommodation expenses in 2017/18 and 80% over the past five years.
Newham Council, in east London, spent the most of any authority in 2016/17 with a £61.1m bill – up £11.5m from the previous year. Unfortunately, it would not release the 2017/18 figure as it said it has not yet been finalised, but the borough remains England’s homeless capital with an estimated one in 25 people in temporary accommodation, so it would likely top the list again given the number of households it had in temporary housing rose by 435.
For the purposes of the data, we have assumed its spend would be the same as the previous year – though in reality it may well have increased.
“Soaring rents, a skewed housing market and stagnant wages are fuelling the housing crisis we are seeing in Newham and across London,” a spokesperson for the council tells Inside Housing. “In Newham, we have lost 1,178 social rent council homes over the past eight years and it is one of the reasons why the number of genuinely affordable homes we have has declined dramatically. Until we can change that, we have little choice but to house our residents in expensive temporary accommodation which is not ideal at all.”
Hackney, Enfield and Westminster also had enormous bills in 2017/18, spending £54.8m, £49.9m and £48m respectively.
Outside London, the biggest spender was Birmingham City Council – the country’s largest local authority – which handed over nearly £23m last year. Manchester, Brighton and Hove, and Luton were the only other non-London councils in the top 30.
Most councils have seen their temporary accommodation spending spiral over the previous five years. For some, like Folkestone and Hythe in Kent on the South Coast, the bill has increased more than fourfold. Both say they have now overhauled their homelessness strategies.
Meanwhile, Peterborough City Council’s outlay surged in 2016/17. Its spend last year was £3.7m, compared with £235,000 in 2013/14. A spokesperson for the authority says the rise was “due to an unprecedented increase in demand from households presenting to us as homeless, at the same time as seeing reducing numbers of available affordable rented accommodation”.
In response, it has expanded its housing team to prevent more cases of homelessness and set up a joint venture to deliver affordable housing.
There were some areas which managed to reduce their costs, however. For instance, Great Yarmouth Borough Council’s temporary accommodation spending plummeted from £1.2m in 2013/14 to £139,000 last year. It said that was down to a number of expensive lease agreements coming to an end and being replaced with cheaper alternatives.
The figures we gathered also provide an insight into where the money is going. Of the councils which released information, 181 broke the data down into different types of temporary accommodation spending.
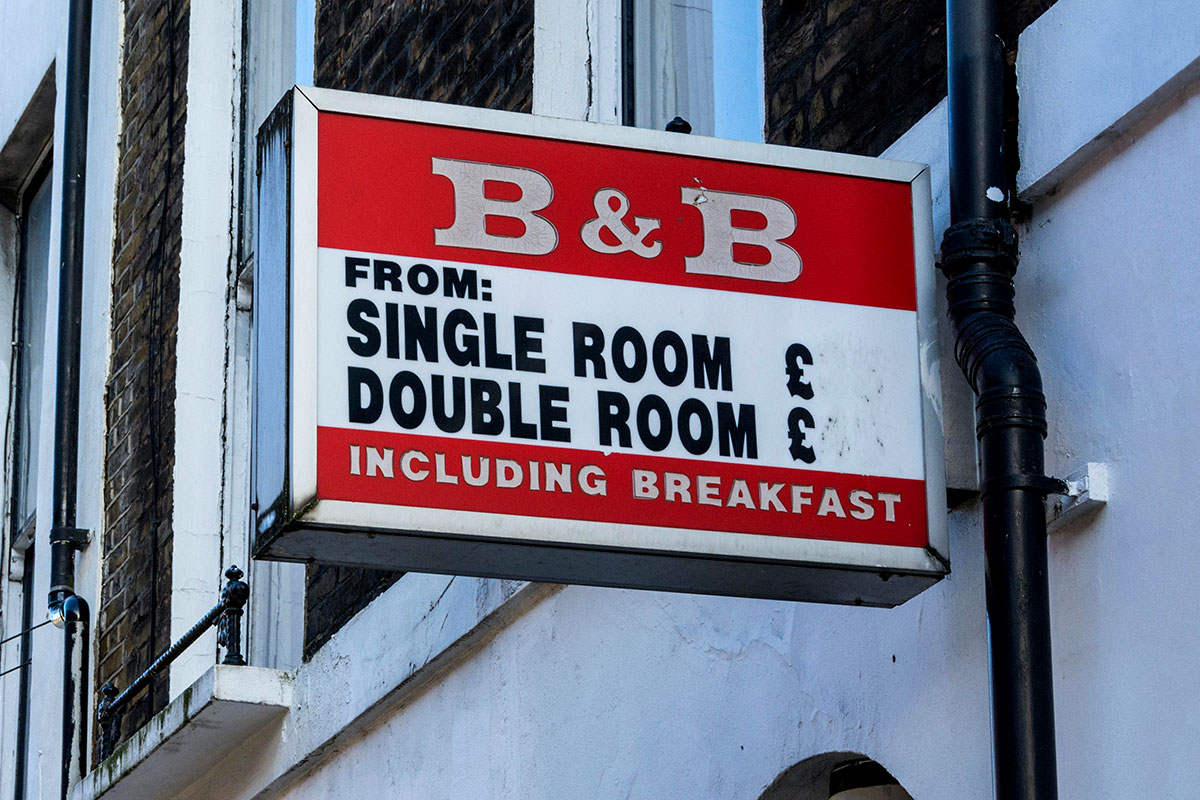
These authorities spent just over £1bn putting up homeless people in B&Bs, hotels and guest houses in the past five years – with an 83.4% yearly rise over that period not including the figure for Newham in 2017/18.

Stratford, Newham. The east London borough spent the most on temporary accommodation in 2016/17 (picture:Getty)
They also paid out a little over £1bn for private sector temporary accommodation, most commonly either leased from individual private landlords or contracted out to companies. Inside Housing has previously revealed that hundreds of these properties are ex-local authority homes sold under the Right to Buy.
Spending in this area – which will include repairs and maintenance costs on leased properties – increased 11.3% over the period covered, again not including Newham.
Of course, the true figure for spending on B&Bs and other private sector temporary accommodation across all 326 councils with responsibility for homelessness in England will be significantly higher. In comparison, these 181 respondents specified just £18.9m of spending on temporary accommodation agreements with housing associations over the same period, with annual amounts staying pretty much flat.
Another £321m was spent keeping homeless people in hostels – though this data is less useful as most authorities did not specify whether the hostels were council-owned, from a housing association or private provider. Most of the remaining spending is accounted for by local authority temporary accommodation.
"The true figure for spending on B&Bs and other private sector temporary accommodation across all 326 councils with responsibility for homelessness in England will be significantly higher"
The Ministry of Housing, Communities and Local Government points to the work of its homelessness advice and support team, aimed at helping councils with families in B&Bs for longer than the six-week legal limit. It says the team’s work saw the number of families with children in B&Bs drop by 24% between September and December 2017.
A spokesperson also cites the £1.2bn it is providing through a range of homelessness reduction programmes “so those who are homeless get the support they need”.
It’s not clear whether temporary accommodation costs will rise or fall. The Homelessness Reduction Act 2017, which came into force in April, places new duties on local authorities in an attempt to cut the number of people who become homeless in the first place. For instance, councils now intervene 56 days before a tenant is given a notice period, double the previous time frame.
Critics say that the £72.7m provided by government over the next three years to cope with these new responsibilities is inadequate, and the efficacy of the new homelessness strategies introduced by many town halls in response to the act is as yet unproven.
In any case, ministers, civil servants and councils will no doubt be desperate to get a handle on the spiralling cost of homelessness.
Inside Housing Spotlight

Inside Housing Spotlight is a series of pieces showcasing the best of our investigative and data journalism.
Spotlight pieces:
14 December 2018: Starting to bite - how Universal Credit is making people homeless: we reveal new figures showing a clear link between Universal Credit and homelessness
9 November 2018: First Priority - the inside story of a housing association which almost went bust When a small supported housing provider entered into a series of leasing deals with investment funds, it nearly spelled disaster for its vulnerable tenants. We investigate why.
12 October 2018: The ballad of Knowsley Housing Trust the inside story of the first housing association made non-compliant by the sector's watchdog for fire safety issues
13 September 2018: How tweaked building guidance led to combustible insulation on high rises: an investigation shows how lobbyists from the plastic insulation industry supported a quiet tweak to building guidance to permit combustible insulation on tall buildings
31 August 2018: The true cost of homelessness Freedom of Information requests reveal the soaring costs of temporary accommodation
30 August 2018: The forgotten threat to high rise tenants We investigate the threat posed by combustible window panels on social housing high rises
13 June 2018: The Biggest Ever Survey of Fire Risk Assessments Data journalism revealing widespread fire safety issues in more than 1,500 tower blocks across the country
12 April 2018: A Section 106 Story An investigation into allegations of "sham transactions" involving Section 106 deals in south London
23 March 2018: The Paper Trail: The Failure of Building Regulations A lengthy investigation into the failures of building regulation that may have contributed to the Grenfell Tower disaster, and the many missed warnings
23 February 2018: The Kingspan Papers Leaked meeting notes reveal some worrying issues, including allegations of fire safety report doctoring by manufacturers
9 February 2018: Gentoo: a Sunderland story We look back at the recent history of Sunderland’s largest housing association.
25 January 2018: Homeless families face long stays in council-owned hostels we reveal how councils in London are skirting the law by using hostels to house people in temporary accommodation for more than six weeks
7 December 2017: Council house to private rent We reveal the percentage of former Right to Buy homes in the private rented sector has passed 40%
17 November 2017: Rent to buy, or rent to rent? A look at how successful the government's Rent to Buy schemes have been
7 September 2017: Once upon a time in the west The history of KCTMO in the years before the Grenfell Tower fire
11 August: 2017 Grenfell: The paper trail - our news editor Pete Apps examines seven years of council documents to tell a story of the missed opportunites to prevent the Grenfell tragedy
4 August 2017 : Knowing the risks – the most common fire safety problems in tower blocks
26 May 2017: Rents hiked for RTB replacements – Sophie Barnes reveals less than half of Right to Buy replacement homes are for social rent
12 May 2017: A stark warning – a prescient piece looking at lessons to be learned from the Shepherds Bush tower block fire
13 April 2017: Where the axe will fall – a look at plans to axe housing benefit for younger people
10 Feb 2017: Circle of Despair – the inside story of Circle's repairs and maintenance troubles
3 Feb 2017: The Benefit Cap Tightrope – Sophie Barnes unveils the first exclusive analysis of the lower benefit cap


